Network anomaly detection explained: how it works, methods, and limitations
Key insights
Network anomaly detection flags deviations from a learned baseline of normal traffic to catch threats that signatures miss — including malware-free intrusions that now make up the majority of cases.
The end-to-end pipeline is consistent across implementations: collect telemetry, learn a baseline, score deviations, enrich with context, then alert and triage.
Choosing between statistical, machine learning, and deep-learning methods comes down to four factors — labeled-data availability, seasonality, interpretability needs, and tolerance for false positives.
Anomaly detection still works on encrypted traffic because it reads metadata — flow records, packet timing and size, and beaconing cadence — that survives encryption.
It is one layer, not a silver bullet: baselines drift, can be poisoned, and miss attacks that produce no anomaly, so it works best inside a broader NDR strategy.
Network anomaly detection is the practice of identifying deviations from a learned baseline of normal network behavior to surface threats that have no known signature. Also called network behavior anomaly detection (NBAD), it watches how traffic actually behaves — who talks to whom, when, how much, and over which protocols — rather than matching files against a list of known-bad patterns. That distinction matters more every year. The majority of intrusions are now malware-free, built on stolen credentials and living-off-the-land techniques that leave no file for a signature to catch (Mandiant M-Trends 2026). Anomaly detection catches the behavior, not the file, which is why it has become a core technique inside network detection and response. This guide walks through what it is, how it works end to end, which detection approach fits which environment, how it handles encrypted traffic, and where its honest limits lie.
What is network anomaly detection?
Network anomaly detection is a detection methodology that identifies deviations from a learned baseline of normal network behavior to surface threats with no known signature. It is a technique, not a product category — a way of finding attacks by watching how the network behaves rather than by matching traffic against a database of known threats.
Security teams often meet the same idea under a second name: network behavior anomaly detection, or NBAD. The two terms describe the same approach, so treat them as synonyms.
The reason this approach has moved to the center of modern defense is structural. Signature-based tools work by recognizing something they have seen before — a known malware hash, a known exploit string, a known bad domain. But the majority of intrusions today are malware-free, relying on stolen credentials, legitimate administrative tools, and living-off-the-land techniques that produce no file and trip no signature (Mandiant M-Trends 2026). When an attacker logs in with valid credentials and uses built-in tools, there is nothing for a signature to match. There is, however, behavior to observe.
A simple analogy helps. Think of a baseline as a fingerprint of normal — a learned profile of how each user, device, and network segment usually behaves. When an account that has only ever touched marketing systems suddenly starts pulling records from payroll, no signature fires, but the behavior is clearly out of character. That contextual shift is exactly what anomaly detection exists to flag. It is a form of anomaly detection applied specifically to network traffic, and it sits as one detection technique inside the broader network detection and response category rather than replacing it.
How network anomaly detection works
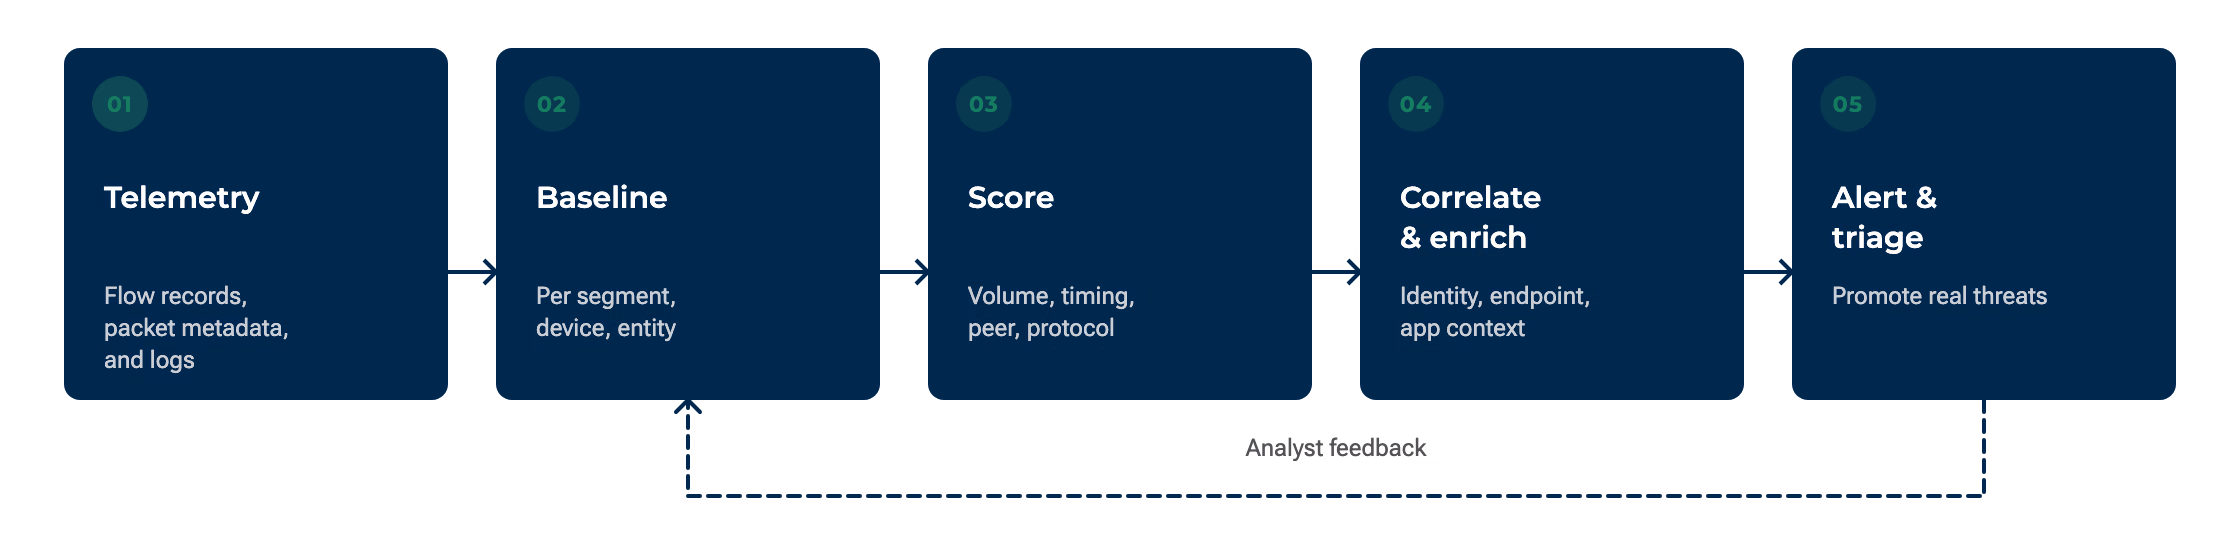
At its heart, network anomaly detection runs a continuous, self-updating loop: it collects telemetry, learns a baseline, scores deviations, enriches them with context, then alerts. Each stage feeds the next, and the baseline keeps adapting as the network changes. Here is the end-to-end flow:
Collect telemetry from flow records, packet metadata, and logs.
Establish a baseline of normal behavior per segment and entity.
Score traffic that deviates from that baseline.
Correlate related deviations across hosts and sessions.
Enrich with identity, endpoint, and application context.
Alert on high-confidence anomalies and feed triage.
Step 1 — Collect telemetry. The system ingests data about how traffic moves: flow records such as NetFlow, sFlow, and IPFIX (compact summaries of who connected to whom, for how long, and how much data moved), packet metadata, and logs. Where this data comes from and how completely it covers the environment is a prerequisite for everything downstream, which is why visibility is treated as its own discipline — see network visibility for the data-source detail rather than re-deriving it here.
Step 2 — Establish a baseline. The system models what normal looks like for each segment, device, and entity. Baselines can be static (fixed thresholds set once) or adaptive (continuously relearned), and the better implementations are adaptive — they account for daily and weekly rhythms so a Monday-morning login surge or a nightly backup job is recognized as normal, not flagged as an attack. Mature systems also use multi-granularity or micro-baselines, modeling behavior globally and then per segment, per device, and per user so that subtle, localized deviations still stand out.
Step 3 — Score deviations. Traffic that departs from the baseline receives an anomaly score. Deviations show up across several dimensions at once — volume (an unusual amount of data), timing (activity at an odd hour), peer group (a device behaving unlike its peers), and protocol (an unexpected service appearing).
Step 4 — Correlate and enrich. A single odd connection rarely means much on its own. The system correlates related deviations and adds identity, endpoint, and application context so that an isolated blip becomes an interpretable signal — an actual story about what an entity is doing.
Step 5 — Alert and triage. Finally, high-confidence anomalies are surfaced to analysts and fed into downstream response. The goal is not to raise every deviation but to promote the ones worth a human's attention.
One practical expectation to set early: machine learning-based systems typically need around 2–4 weeks of normal traffic to establish a reliable baseline — a figure widely cited as common industry implementation guidance. Start with conservative thresholds during that window, then tighten them as the model's picture of normal sharpens.
The network anomaly detection pipeline — a continuous loop from telemetry collection through baselining, scoring, enrichment, and alerting, with analyst feedback retraining the baseline.
Process diagram (described): A left-to-right flow of five labeled nodes connected by directional arrows — "Telemetry (flow, packet metadata, logs)" feeds "Baseline (per segment, device, entity)," which feeds "Score (volume, timing, peer, protocol)," which feeds "Correlate and enrich (identity, endpoint, app context)," which feeds "Alert and triage." A dashed feedback arrow loops from "Alert and triage" back to "Baseline," showing that analyst dispositions retrain the model.Figure 1. T
Types of network anomalies
Anomalies fall into a few well-established classes, and understanding them helps explain both what a detector looks for and why it sometimes gets things wrong. The most common framework borrows three categories from data science.
Point anomalies — a single observation that is abnormal on its own, such as one host suddenly transferring 50 GB outbound when it normally sends a few megabytes.
Contextual anomalies — behavior that is normal in one context but abnormal in another, such as a database backup that is routine at 2 a.m. but suspicious at 2 p.m.
Collective anomalies — a sequence of individually unremarkable events that together signal a problem, such as a slow, methodical scan touching one new host every few minutes.
Alongside this statistical taxonomy, practitioners use a more operational vocabulary grouped by what changed: volume anomalies (unusual amounts of data), time-based anomalies (activity at unexpected hours), protocol anomalies (an unexpected service or protocol appearing), and behavioral anomalies (an entity acting unlike its normal self or its peers). A protocol anomaly is easy to picture — if encrypted DNS over HTTPS (DoH) suddenly appears from a host that has never used it, that newly emerging protocol is worth a closer look even though nothing about it is inherently malicious.
The distinction that makes anomaly typing genuinely actionable, though, is direction. North-south anomalies involve traffic crossing the network perimeter — ingress and egress — and often point to command-and-control or data exfiltration. East-west anomalies involve internal, host-to-host traffic and often indicate lateral movement as an attacker spreads from an initial foothold. Tying each anomaly to a direction starts to reveal what an attacker is actually trying to do, a mapping that lands fully in the "in practice" section below. Volume and timing deviations are also where this discipline overlaps with broader network traffic analysis, which examines the same flows for performance and security insight.
Detection approaches: statistical vs machine learning vs deep learning
Choosing a detection approach is where most guidance goes quiet — competitors list the techniques but rarely tell you which to pick. The honest answer is that the right choice depends on four things: whether you have labeled incident data, how seasonal your traffic is, how much you need to explain why an alert fired, and how many false positives your team can absorb. Four families of methods sit on that spectrum.
Statistical and threshold methods compare live traffic against fixed or rolling statistical limits. They are fast, interpretable, and well suited to stable, well-understood patterns, but static thresholds generate false positives the moment legitimate traffic shifts. Unsupervised machine learning — clustering and algorithms such as Isolation Forest — learns structure from unlabeled data, which makes it strong at flagging novel threats no one has labeled yet, at the cost of being tuning-sensitive. Supervised machine learning trains on labeled examples of known-bad behavior and is precise on those known classes, but it is blind to anything it was never shown. Semi-supervised and deep-learning methods — autoencoders and LSTM models for time-series traffic — capture temporal and seasonal structure that simpler methods miss, but they are data-hungry and computationally expensive.
Higher when thresholds are static and traffic shifts
Unsupervised ML (clustering, Isolation Forest)
Unlabeled traffic
Novel and unknown threats; environments without incident labels
Moderate; sensitive to tuning and baseline quality
Supervised ML
Labeled incident data
Precise detection of known attack classes
Low on known classes; blind to the unseen
Semi-supervised / deep learning (autoencoder, LSTM)
Large volumes; mostly unlabeled
Temporal and seasonal patterns; relational structure
Low once trained; data- and compute-intensive to get there
Table 1. Choosing a network anomaly detection approach by data availability, fit, and false-positive behavior.Alt text: Four-row comparison table mapping statistical, unsupervised ML, supervised ML, and deep-learning approaches to their data needs, ideal use cases, and false-positive characteristics.
In practice, the strongest systems are hybrids that combine statistical methods with machine learning, using fast statistical checks to catch obvious deviations and ML to find subtler ones. The research frontier has also moved well past the classic KDD-style benchmark datasets toward graph neural networks and self-supervised training that learn from relationships and metadata rather than labeled payloads (ML-based network anomaly detection, MDPI, 2024). That direction is not just academic: peer-reviewed work on east-west detection has shown graph-based models improving accuracy while cutting operational cost (NetVigil, NSDI 2024).
Two common comparison questions deserve quick, direct answers here. Anomaly-based versus signature-based detection is not an either-or — they are complementary, with signatures catching the known and anomaly detection covering the novel. And anomaly detection versus an intrusion detection system is a category question rather than a methodology one, since an IDS may itself be signature- or anomaly-based. The deeper analytics that power entity- and peer-group modeling are covered under behavioral analytics, and product comparisons belong with network anomaly detection tools rather than this methodology page.
Detecting anomalies in encrypted traffic
A reasonable objection to network monitoring is that most traffic is now encrypted — so what is left to inspect? It is a real concern. Industry analysis of encrypted traffic in 2024 found that the majority of threats are now delivered over encrypted channels, and TLS 1.3 with Encrypted Client Hello (ECH) continues to erode whatever payload visibility remained (neutral media coverage). The good news is that anomaly detection does not depend on reading payloads.
When the contents are sealed, the behavior still leaks. Several signals survive encryption and remain fully readable:
Flow records — who connected to whom, for how long, and how much data moved in each direction.
Packet size and timing — the rhythm and shape of a conversation, which differs for a file transfer, a video stream, and an automated callback.
SNI and certificate metadata — the negotiated destination and certificate details exchanged before encryption fully engages.
Beaconing cadence — the regular, periodic callbacks a compromised host makes to its controller, which show up as suspicious periodicity even when every packet is encrypted.
This is precisely where anomaly methods outperform signatures. A signature needs a payload to match, and there is none. But behavior — an unusual outbound volume ratio, a too-regular heartbeat, a connection at the wrong time of day — still deviates from baseline. Beaconing is the clearest example: a host phoning home every 60 seconds with near-identical session sizes is a periodicity anomaly that maps directly to application-layer command-and-control (MITRE T1071), detectable without ever decrypting a byte. Reading these metadata signals at scale depends on capturing the right telemetry, which is the domain of network visibility; the underlying challenges of encrypted-traffic analysis under TLS 1.3 are well documented in the academic literature (TLS 1.3 encrypted-traffic analysis survey, 2024).
Network anomaly detection in practice
Anomaly classes become useful the moment they map to attacker behavior. North-south egress and volume anomalies on an established connection suggest data leaving over an existing command-and-control channel. Beaconing cadence points to application-layer C2. East-west RDP fan-out — one internal host suddenly opening remote-desktop sessions to many others — suggests lateral movement. The table below makes those mappings concrete using MITRE ATT&CK technique IDs.
Unusual lateral remote-desktop connections from a single host
Table 2. Mapping common network anomaly types to attacker behavior and MITRE ATT&CK techniques, with a detection idea for each.Alt text: Three-row table linking egress-volume, beaconing, and internal-RDP anomalies to their traffic direction, MITRE technique identifier, and a corresponding detection approach.
Two real cases bracket the tempo at which these anomalies appear. At the slow end, the Change Healthcare breach (February 2024) saw attackers enter through a portal that lacked multi-factor authentication and then move laterally for roughly nine days before detonating ransomware (Change Healthcare cyberattack timeline, MSSP Alert). That nine-day east-west window — new credentials, unusual internal access, abnormal reach toward sensitive systems — is exactly the kind of signal anomaly detection exists to surface before encryption fires. At the fast end, an Akira ransomware campaign abusing exposed VPN access went from initial login to encryption in four hours or less (Akira–SonicWall under four hours, Help Net Security). The Akira operation behind it has compromised more than 250 organizations since March 2023 and claimed roughly $244 million in ransom proceeds as of September 2025 (joint CISA-FBI advisory, updated November 2025), and its exploitation of exposed edge devices continues (SecurityWeek).
The broader trend is acceleration. Unit 42 research found the fastest quartile of intrusions reaching data exfiltration in about 72 minutes in 2025, down sharply from nearly five hours the year before (neutral coverage, TechHQ). Edge and VPN appliances have consolidated as a favored initial-access target, and the post-exploitation activity that follows — internal scanning, tunneling, exfiltration — is network-detectable even when the initial exploit is encrypted or fileless (CISA ED 25-03). Mapping these patterns to entity behavior is the province of behavioral threat detection, and the identity and peer-group dimension belongs to user and entity behavior analytics (UEBA). The same baselining logic extends to IoT and operational-technology segments, where device behavior is often more predictable and deviations stand out clearly.
Detecting and preventing false positives
False positives are the single most-cited weakness of anomaly detection, and for good reason: an overly sensitive system can generate hundreds of false alarms a day, which trains a team to ignore alerts entirely. For a small, generalist security team, a noisy detector is worse than no detector. Tuning is therefore not an afterthought — it is the work. A practical workflow looks like this:
Set the baseline window deliberately. Give the model the roughly 2–4 weeks of normal traffic it needs before trusting its picture of normal.
Start conservative, then tighten. Begin with looser thresholds to avoid drowning in alerts on day one, then sharpen them as confidence grows.
Use multi-granularity and peer-group baselining. Compare each entity against its own history and against its peers, so a single device's quirk does not trigger on the whole population.
Enrich with context. Add identity, endpoint, and application data so a benign change — a promotion that grants new access, a newly deployed application — is not misread as a threat.
Build feedback loops. Feed analyst dispositions back into the model so every true and false verdict sharpens the next decision.
The underlying tension is the precision-versus-recall trade-off. Tighten thresholds and you raise precision (fewer false alarms) but risk lowering recall (missing real events); loosen them and you do the reverse. The goal is not to eliminate every false positive but to keep the alert volume low enough that a small team can triage every alert that surfaces. Distinguishing a real threat from an employee who simply changed roles is the core baselining challenge, and the peer-group and entity modeling that solves it is covered in depth under behavioral analytics.
Precision vs recall: Higher precision means fewer false alarms but a greater chance of missing a real event; higher recall means catching more real events at the cost of more noise. Tune toward the balance your team can actually staff.
Standards and compliance grounding
For regulated organizations, network anomaly detection maps cleanly onto recognized frameworks. The NIST Cybersecurity Framework (CSF) 2.0 Detect function names it directly: DE.CM covers continuous monitoring of networks to find adverse events, and DE.AE covers the adverse-event analysis that consumes anomaly output (NIST Cybersecurity Framework). Foundational guidance goes back further. NIST SP 800-94 defines anomaly-based detection using static versus dynamic profiles of normal behavior, and it candidly flags a core limitation — analysts often find it hard to determine why an alert fired (NIST SP 800-94, 2007 final). One caveat worth knowing: the planned revision, SP 800-94 Rev. 1, was withdrawn on 2022-07-15 rather than finalized, so the 2007 edition remains the standard anchor while NIST has signaled forthcoming replacement IDS/IPS guidance. Anomaly detection is one well-grounded layer within the broader discipline of network security.
Limitations of network anomaly detection
A credible account of anomaly detection has to name what it cannot do. It is one layer, not a silver bullet, and several limitations are inherent to the approach:
No-anomaly attacks slip through. An intrusion that closely mimics normal behavior may never deviate enough to score, and what produces no anomaly produces no alert.
Concept drift. Networks change constantly — new apps, new users, new architectures — and a baseline that is not continuously relearned grows stale and inaccurate.
Baseline poisoning. A patient attacker can introduce malicious behavior slowly enough that the model learns to treat it as normal.
Adversarial evasion. Models can be probed and gamed, with traffic deliberately shaped to stay under scoring thresholds.
Validation difficulty. As NIST SP 800-94 notes, it is genuinely hard to determine why an anomaly-based alert fired and to confirm it is not a false positive (NIST SP 800-94, 2007 final).
None of this argues against anomaly detection — it argues for using it correctly. The methodology complements rather than replaces signature-based systems (Wikipedia: network behavior anomaly detection), and it delivers the most value as one well-tuned component inside a layered network detection and response strategy rather than as a standalone defense.
Modern approaches to network anomaly detection
The field is moving toward models that learn from relationships and sequences rather than labeled payloads. Graph neural networks model the network as a web of connected entities, Transformer and sequence models capture how behavior unfolds over time, and self-supervised training sidesteps the reality that labels are scarce and perishable — all increasingly evaluated on modern benchmarks rather than legacy datasets (ML-based network anomaly detection, MDPI, 2024). When you evaluate any modern approach, the vendor-neutral markers to look for are real-time scoring, explainability, peer-group and entity baselining, encrypted-traffic coverage, and low analyst overhead. This is also where the distinction between a technique and a platform matters: anomaly detection is one input, while network detection and response is the broader category that operationalizes it alongside other detections, investigation, and response. The same shift is visible across AI threat detection more broadly.
How Vectra AI thinks about network anomaly detection
Vectra AI treats network anomaly detection as one input to Attack Signal Intelligence™ rather than as a destination. Behavior-based detections are automatically triaged, stitched together across the network into attack graphs, and prioritized by likely impact, so a resource-constrained team sees a short list of real attacks in progress rather than a flood of raw anomalies. The guiding principle is signal over noise: the value is not in flagging every deviation but in turning the meaningful ones into a clear, prioritized picture of what an attacker is doing.
Future trends and emerging considerations
Network anomaly detection is changing alongside the threats it tracks, and the next 12–24 months point in a few clear directions. The first is speed. With the fastest intrusions now reaching exfiltration in roughly an hour (Unit 42 research, TechHQ), detection that operates in batch or after the fact is losing relevance — real-time scoring is becoming table stakes. At the same time, global median dwell time rose to 14 days in 2025, up from 11 days in 2024 (Mandiant M-Trends 2026), a reminder that many intrusions still linger long enough for behavioral detection to matter. The spectrum from a four-hour smash-and-grab to a nine-day dwell is exactly why behavioral coverage has to span both ends.
The second shift is in the models themselves. Expect continued movement toward graph neural networks, Transformer-based sequence models, and self-supervised training that learns from metadata and relationships instead of scarce labels — an approach validated by peer-reviewed results showing better accuracy at lower cost (NetVigil, NSDI 2024). The third is the attack surface. Edge and VPN appliances have become a primary initial-access target, and because post-exploitation activity is network-observable even when the exploit is encrypted, anomaly detection on internal and egress traffic is a natural backstop where perimeter prevention fails (CISA ED 25-03).
Finally, standards are due for a refresh. With NIST SP 800-94 Rev. 1 withdrawn, organizations should watch for the replacement IDS/IPS guidance NIST has signaled, and should ground their programs in the NIST CSF 2.0 Detect categories in the meantime. The practical takeaway for teams planning investment: prioritize real-time, explainable, metadata-capable detection with low analyst overhead, and treat encrypted-traffic coverage as a requirement rather than a nice-to-have.
Conclusion
Network anomaly detection earns its place in modern defense by catching what signatures cannot — the malware-free, credential-driven, living-off-the-land intrusions that now dominate the threat landscape. It works by learning a baseline of normal, scoring deviations, enriching them with context, and surfacing the ones that matter, and it keeps working even when traffic is encrypted because behavior leaks through metadata. The methodology is not magic: baselines drift, can be poisoned, and miss attacks that produce no anomaly, which is why the right choice of approach and disciplined false-positive tuning matter so much. Treated as one well-tuned layer inside a broader network detection and response strategy — and grounded in frameworks like NIST CSF 2.0 — it turns raw network behavior into the early warning a resource-constrained team can actually act on. To see how anomaly-based detections become prioritized, investigable signal, explore Vectra AI's approach to AI threat detection.
FAQs
What is the difference between network anomaly detection and an intrusion detection system?
Network anomaly detection is a methodology — it flags deviations from a learned baseline of normal behavior. An intrusion detection system is a specific product class that can be built on signatures, on anomaly detection, or on both. In other words, anomaly detection is one technique an IDS might use, not a competing product.
What is the difference between network anomaly detection and NDR?
Network anomaly detection is a single detection technique. Network detection and response is the broader platform category that uses anomaly detection alongside other detection methods, investigation, and automated response. Put simply, anomaly detection is one capability inside NDR rather than a substitute for it.
How long does it take to establish a reliable baseline?
Machine learning-based systems typically need around 2–4 weeks of normal traffic to learn a dependable baseline. The recommended practice is to start with conservative thresholds during that window and tighten them as the model's understanding of normal sharpens. Networks that change frequently may need ongoing relearning to stay accurate.
Can network anomaly detection work on encrypted traffic?
Yes. Anomaly detection reads metadata that survives encryption — flow records, packet timing and size, and beaconing cadence — rather than payload contents. This is exactly why it outperforms signature-based tools on encrypted traffic, where there is no payload left to match.
How do you reduce false positives in network anomaly detection?
Use multi-granularity and peer-group baselining so each entity is judged against its own history and its peers, and enrich alerts with identity, endpoint, and application context so benign change is not mistaken for a threat. Then feed analyst dispositions back into the model so it keeps improving. Setting a deliberate baseline window and starting with conservative thresholds also helps considerably.
What is the difference between supervised and unsupervised anomaly detection?
Supervised models learn from labeled examples of known incidents and are precise on those known attack classes, but blind to anything they were not trained on. Unsupervised models need no labels and learn the structure of normal traffic directly, which makes them better at catching novel, never-before-seen threats. Many production systems combine both to balance precision with novelty coverage.