Network security analytics: detection analytics applied to network telemetry
Key insights
Network security analytics applies detection analytics to network telemetry, flow, packet, DNS, and metadata, to ask whether traffic behaves adversarially rather than whether the network performs well.
The discipline works by baselining normal behavior for every host and account, then ranking deviations, because attackers holding valid credentials produce no signature to match.
Encryption removed payload inspection, not detection. Fingerprints, flow shape, certificate anomalies, and beaconing periodicity all remain observable without decrypting a single session.
Attackers who live off the land, and devices that cannot run an agent, are invisible to endpoint tooling. Their behavior stays unavoidably visible in network telemetry.
Network security analytics is the discipline. NDR productizes it, NTA narrows it, SIEM correlates logs instead, and NIST, MITRE, and CIS all codify the practice.
Network security analytics is the practice of applying detection analytics to network telemetry, flow records, packet data, DNS activity, and protocol metadata, to determine whether something on the network is behaving like an adversary. It is narrower than generic security analytics, which spans logs, identity, endpoint, and cloud events across every surface. It is not network performance analytics, which asks whether the network is healthy rather than whether it is compromised. And it is not a product: network detection and response (NDR) packages these analytics with response capabilities, while SIEM correlates logs rather than observing traffic.
One historical note explains much of the confusion: the term was productized by vendors years ago, and search tools still resolve it to a legacy product name, but the discipline stands apart from any product. This page defines that discipline, shows what its telemetry catches that endpoint tooling cannot, and maps it to the frameworks that now expect it.
What is network security analytics?
Network security analytics applies detection logic to network telemetry, asking whether traffic looks adversarial rather than whether the network is performing well. The discipline exists because network telemetry answers questions no other data source can. Every attacker action that crosses the wire, authentication, discovery, movement between hosts, staging, and exfiltration, leaves a trace in traffic, whether or not an agent is installed and whether or not a log gets written. Network traffic analysis (NTA) supplies the observational foundation. Network security analytics adds the detection layer on top: baselines, models, and analytics that turn observation into verdicts. It operates as the detection layer inside a broader network security program.
That coverage argument is also why security analytics matters at all, both in its generic form, sometimes labeled cybersecurity analytics, and in this network-scoped form. Analytics converts telemetry an organization already generates into detection coverage for the assets its agents and logs miss: unmanaged devices, east-west traffic between internal hosts, and encrypted sessions no payload inspection can read.
Dimension
Network security analytics IS
Network security analytics IS NOT
Primary telemetry
Built on flow, packet, DNS, and protocol metadata
Built on latency, throughput, and error counters
Primary question
Asking whether something on the network is behaving like an adversary
Asking whether the network is fast, available, and healthy
Typical owner
Run by the SOC and detection engineers
Run by network operations and capacity planning teams
What it replaces
A successor to signature-only inspection of network traffic
A replacement for EDR, SIEM, or preventive controls
What it does not replace
A complement to endpoint, identity, and log analytics
A standalone security program on its own
Five dimensions that separate network security analytics from the disciplines it is most often confused with.
Network security analytics sits where detection analytics meets network telemetry, and NDR packages that intersection into a product category with response.
Network security analytics vs network performance analytics
The phrase network analytics usually refers to the performance practice, and the two fields share a data source while asking different questions. Performance analytics measures latency, throughput, error rates, and capacity so operations teams can keep the network healthy. Network security analytics reads the same flows and asks whether anything on the network is behaving like an adversary. A saturated link is a performance event. A workstation quietly opening connections to internal servers it has never touched is a security event, and only one of these disciplines is designed to notice it. If a finding would fit unchanged in a capacity planning report, it belongs to performance analytics, not here.
How network security analytics works
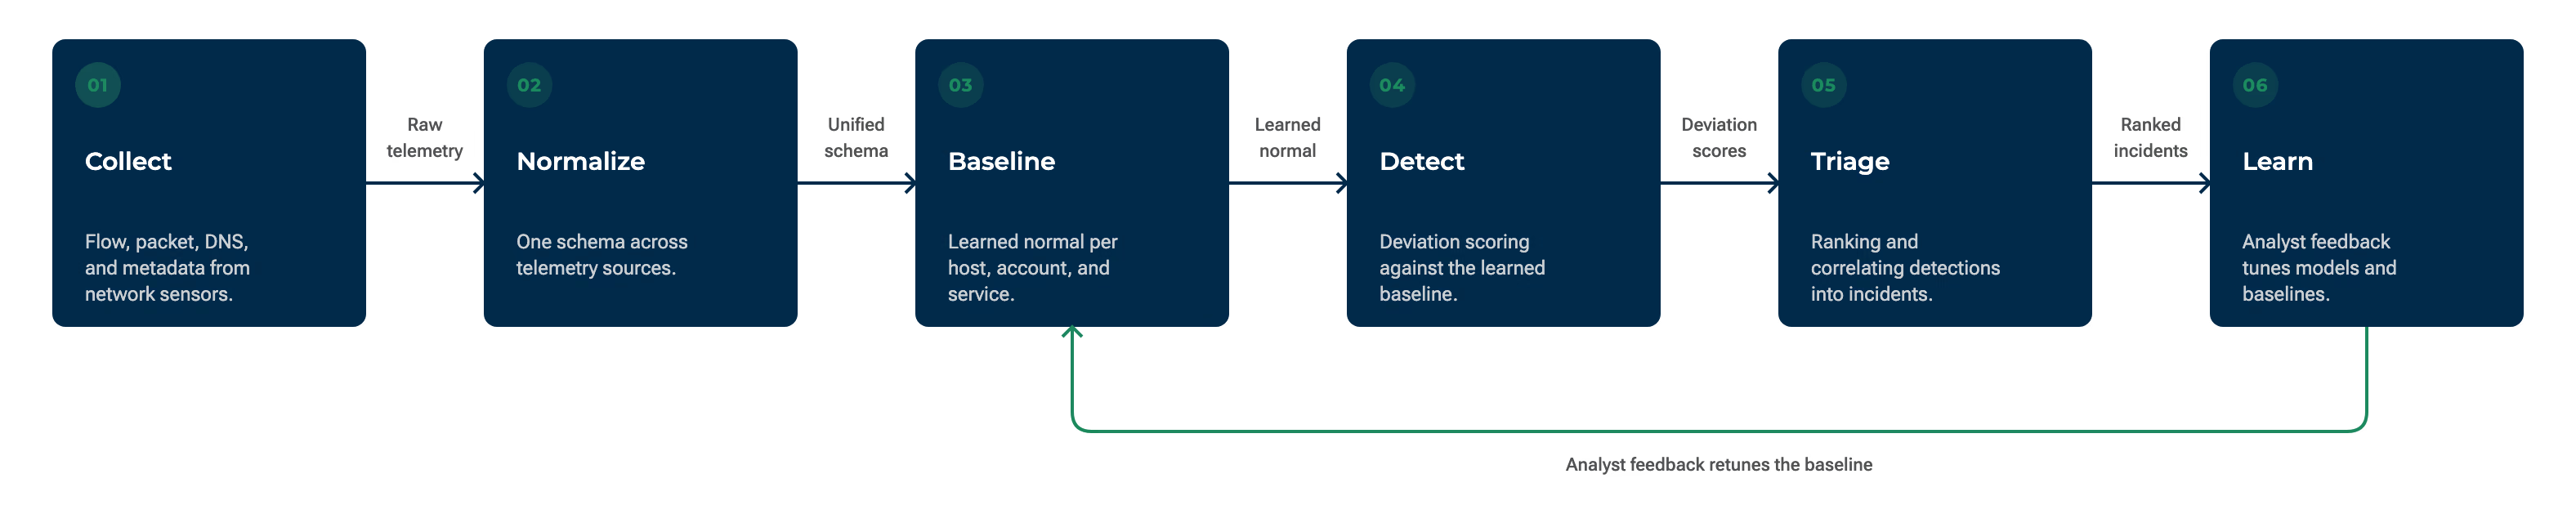
Network security analytics collects flow, packet, DNS, and metadata telemetry, baselines normal behavior for every host and account, then ranks deviations for investigation. The pipeline is consistent across environments: collect, normalize, baseline, detect, triage, and learn. Each stage feeds the next, and the loop closes when analyst outcomes retune the baseline.
Network security analytics turns raw telemetry into ranked detections through a continuous baseline-and-learn loop.
The telemetry layer
Collection starts with four telemetry families, and choosing among them is a cost decision as much as a coverage decision.
Telemetry type
What it captures
Questions it can answer
Retention cost profile
Flow (NetFlow, IPFIX)
Summarized session records: endpoints, ports, protocol, timing, and volume, without payload
Who talked to whom, when, how often, and how much moved
Low. Months of history are affordable
Full packet capture (PCAP)
Complete sessions, including headers and payload
Exactly what crossed the wire in a given session
Highest. Typically days, reserved for high-value segments
Which client, which certificate, and which command, without storing full payload
Moderate. Weeks to months are practical
DNS
Queries, responses, and resolution failures
Which domains resolved, which never existed, and which host kept asking
Low. Long retention is practical
The four core telemetry families, what each answers, and what each costs to keep.
Flow records map to what MITRE ATT&CK catalogs as DC0078 Network Traffic Flow: summarized records of network connections and sessions rather than their contents. Full packet capture, known as PCAP, preserves everything but costs the most to retain. Most programs therefore run flow collection everywhere, add protocol metadata broadly, and reserve packets for the segments that justify the storage. IP Flow Information Export (IPFIX) and NetFlow are the standard flow formats, and DNS telemetry rounds out the set because almost every intrusion eventually asks a name server for directions.
Baselining and behavioral detection
A baseline is a statistical picture of normal: which hosts talk to which services, at what hours, over which protocols, and in what volumes. Detection then becomes a measurement of deviation from that picture rather than a match against a known signature. This is network anomaly detection applied with security intent, and it is the mechanism behind network behavior analysis. The vocabulary matters here. Behavioral analytics is a general method: modeling how entities normally act and flagging departures. Network behavior analysis is that method scoped to the network, watching how data normally moves and surfacing traffic that breaks the pattern.
Deviation catches what signatures cannot. Verizon's 2026 Data Breach Investigations Report, published May 2026 and covering 2024-11-01 to 2025-10-31, puts credential abuse at 13% of initial access vectors (Verizon 2026 DBIR executive summary). Once a stolen credential is in use, the activity it drives concentrates in east-west movement, the traffic between internal hosts that perimeter tools never inspect. A valid login deviates from nothing an endpoint measures, but the connection pattern it produces deviates from baseline. The same property exposes insider threats, whose access is authorized while their behavior is not. In practice, the deviations worth ranking span internal reconnaissance, command-and-control beaconing, staging, and exfiltration.
Machine learning, and where it actually helps
Machine learning earns a specific place in this pipeline, not a magical one. Models cluster related deviations, rank them by how unusual and how attack-consistent they are, and suppress the repetitive noise a static threshold would keep flagging. What models do not do is remove the need for a good baseline. A model trained on a poorly observed network learns a poor definition of normal, and its output inherits the flaw. Accuracy work is baseline work, which is why the tuning guidance in the FAQ below starts there rather than with sensitivity settings.
Sensor placement and retention economics
Where sensors sit decides what the analytics can see. A test access point (TAP) or switched port analyzer (SPAN) session at the internet edge observes north-south traffic, meaning everything that crosses the perimeter. Catching an attacker moving between internal hosts requires east-west coverage too: sensors positioned to observe traffic between internal segments, including data-center and virtualized traffic that never touches the edge. Retention completes the economics. Flow records are compact enough to keep for months, long enough to reconstruct an intrusion discovered late. Full packet capture is priced for days, which returns the decision to the telemetry table above: coverage everywhere first, then depth where it pays.
Detecting threats in encrypted traffic
Encrypted traffic can still be assessed through fingerprints, flow shape, certificate anomalies, and beaconing periodicity, without decrypting a single payload. Encryption is now the default condition of the web, not the exception. Google's Transparency Report shows well over 90% of web pages loading over HTTPS in Chrome, with the share varying by platform, and Linux sitting around 84% (Google Transparency Report). The dashboard is rolling, and its browsing-time chart has been frozen since July 2022, which is why the honest statement is a range rather than a crisp figure. Malware travels the same paths. In WatchGuard's H2 2025 Internet Security Report, published February 2026, 96% of blocked malware across its network, endpoint, and DNS filtering telemetry arrived over TLS (WatchGuard H2 2025 Internet Security Report).
Detection without decryption works because encryption hides payload content, not behavior. A TLS session still exposes who is talking to whom, how often, in what rhythm, and with what handshake characteristics. Every one of those properties can be modeled.
Signal
What it reveals
What TLS 1.3 and ECH change
JA3/JA4 fingerprint
The client software behind a session, derived from handshake parameters
Client handshake parameters stay visible, so fingerprinting continues to work
Packet size and timing profile
Session rhythm, direction, and volume consistent with automated tooling
Nothing. Timing and size are not encrypted
Certificate metadata
Issuer, validity period, and subject anomalies
TLS 1.3 encrypts server certificates in the handshake, removing much of this signal
SNI
The hostname the client asked for
ECH encrypts the SNI field where deployed, removing the signal
Beaconing interval
Periodic callbacks to a fixed destination, a common command-and-control pattern
Nothing. Periodicity is a timing property
Destination reputation and flow volume
Where sessions go, how rare the destination is, and how much data moves
Nothing. Addresses and volumes remain observable
Detection signals that survive encryption, and what TLS 1.3 and encrypted client hello actually take away.
TLS 1.3 and encrypted client hello (ECH) genuinely shrink the visible surface. TLS 1.3 encrypts server certificates during the handshake, and ECH hides the server name indication (SNI) field where it is deployed. Timing, size, direction, volume, and destination survive both, because no protocol change can encrypt when a packet left or how large it was. The honest limitation runs the other way: these are probabilistic signals. A JA4 match or a beacon-like interval narrows the field and prioritizes an investigation. Neither confirms intent on its own. That is the working definition of network visibility under encryption: sustained observability of behavior after payload inspection has gone dark.
What the network sees that the endpoint cannot
When attackers use legitimate tools, valid accounts, and agentless network devices, the endpoint sees nothing unusual and only network telemetry exposes them. This is the strongest justification for the discipline, and it is best walked as a detection-engineering problem rather than a threat story.
A living-off-the-land lateral movement walkthrough
In advisory AA24-038a, released 2024-02-07, CISA documented the state-sponsored actor Volt Typhoon pre-positioning inside US critical infrastructure using living off the land (LotL) techniques: built-in operating-system tools and valid accounts in place of malware (CISA AA24-038a). The table follows that pattern from the defender's side.
Attacker action
What the endpoint agent sees
What network telemetry shows
MITRE data component
Signs in with previously stolen, valid credentials
A normal authentication by a legitimate account
A workstation initiating sessions with servers it has never touched
DC0078 Network Traffic Flow
Runs built-in administrative tooling for discovery
Trusted, signed system binaries executing routine commands
A burst of internal connections fanning out across subnets
DC0078
Moves to other hosts over remote-management protocols
Legitimate services handling legitimate requests
Remote-management sessions between hosts that never previously communicated, visible in protocol metadata
One internal host aggregating unusual volumes from file servers
DC0078
Sends data out over an encrypted channel
An allowed process making an allowed connection
Sustained outbound transfer to a rare destination, far above the sender's baseline
DC0078
Each step of a living-off-the-land intrusion as the endpoint records it and as network telemetry exposes it.
The point lands in the middle columns. Every endpoint observation is individually normal: a legitimate account, a signed binary, an allowed process. The anomaly exists only in the relationships between hosts, which machine reached which server, in what sequence, at what volume, and relationships are a network-layer observation. Lateral movement is invisible to the host it starts from and the host it lands on, and visible only between them. The same holds for data exfiltration: the file read is authorized, but the outbound transfer breaks the sender's baseline.
Independent telemetry now describes this as the mainstream case rather than the exception. WatchGuard's H2 2025 Internet Security Report states that Windows binaries and LotL tools "have become the primary infection vectors, leveraging trusted processes to avoid detection" (WatchGuard H2 2025 Internet Security Report). The stakes compound with time. Mandiant's M-Trends 2026 puts global median dwell time at 14 days for 2025, up from 11 days in 2024, based on more than 500,000 hours of frontline incident response (Mandiant M-Trends 2026). That is an all-environment figure rather than a network-specific one, but every one of those days is time an intruder's traffic was crossing someone's network.
When there is no endpoint agent at all
The walkthrough above assumes an agent that sees nothing useful. A second documented pattern removes the agent entirely. CISA advisory AA25-239A, released 2025-08-27, describes state-sponsored espionage against telecommunications backbone and edge routers: configuration changes, on-device packet capture, and tunneling on hardware where endpoint tooling does not exist (CISA AA25-239A). There is no EDR to evade because there is no EDR to install.
A July 2026 advisory makes the argument actor-agnostic. In AA26-194A, released 2026-07-13, CISA attributes to the Russian FSB's Center 16 a campaign compromising unpatched, end-of-life devices on a widely deployed enterprise router platform over the Simple Network Management Protocol (SNMP) (CISA AA26-194A). The detections CISA prescribes are network-layer controls: maintain a management information base (MIB) allow list, and monitor inbound SNMP Set-Requests carrying object identifiers (OIDs) that target sensitive device data. When the compromised asset cannot host an agent, its behavior observed from the network is the entire detection surface.
Network security analytics vs NDR, NTA, SIEM, and IDS/IPS
Network security analytics is the analytic discipline. NDR productizes it with response, NTA narrows it to traffic observation, and SIEM correlates logs instead. The matrix draws the boundaries, and each neighboring category's own page goes deeper than this one should.
Category
Primary telemetry ingested
What it detects best
Where it overlaps
Go deeper
Network security analytics
Flow, packet, DNS, and protocol metadata
Behavioral deviations across east-west and north-south traffic
The analytic core inside NDR and NTA
This page
NDR
Network telemetry plus response integrations
Active attacker behavior, with containment built in
Six commonly conflated categories, what each ingests and detects, and where each one hands off.
All six serve the same threat detection mission, and they overlap by design rather than by accident. The selection logic is question matching. A SIEM is best when the question is cross-source correlation, compliance evidence, and retention. The network-native categories are best when the question is what attackers are doing on the wire right now, especially where agents cannot go. Intrusion detection and prevention systems (IDS/IPS) remain best at blocking known-bad traffic at defined chokepoints, and XDR is best when detection should stay anchored to a well-instrumented endpoint estate. For the two most frequently confused categories, the dedicated SIEM vs NDR comparison walks the decision in depth.
The generic version of the question, security analytics versus SIEM, resolves the same way. Analytics is the detection capability, and a SIEM is one of the places that capability can run. One adjacent term deserves a sentence too: network security monitoring is the operational practice of running this collection and review continuously, a network-scoped slice of the broader security monitoring discipline rather than a separate technology category.
Framework and regulatory mapping
Network monitoring is an explicit control in NIST CSF 2.0, CIS Control 13, and NIS2, and maps cleanly to two MITRE data components. NIST CSF 2.0, published 2024-02-26, states the requirement verbatim in DE.CM-01: "Networks and network services are monitored to find potentially adverse events" (NIST CSF 2.0, CSWP 29). The control's own implementation example reads like a definition of this discipline: "Compare actual network flows against baselines to detect deviations" (DE.CM-01 reference).
MITRE ATT&CK restructured its detection model recently, and precision matters because much published guidance is stale. Standalone data-source objects were deprecated in v18 (October 2025), the release that replaced per-technique detections with Detection Strategies (ATT&CK v18 release notes). Network detection now maps to two data components: DC0078 Network Traffic Flow and DC0085 Network Traffic Content. DC0078 maps to 127 detection strategies (component v2.1, last modified 2026-05-12), using the Detection Strategies construct that debuted in v18. The v19 release, dated 2026-04-28, extended Detection Strategies to Mobile and retired the Defense Evasion tactic, splitting it into Stealth (TA0005, which inherits the ID) and Defense Impairment (TA0112, a new tactic) (ATT&CK v19 release notes).
CIS Critical Security Controls v8.1 (2024) makes the same demand through Control 13, Network Monitoring and Defense (CIS Control 13). Its safeguards include centralized security-event alerting, network intrusion detection, traffic filtering between network segments, and port-level access control, which together assume exactly the telemetry and analytics described above.
Framework
Control or component ID
How network security analytics maps
Evidence of effectiveness
NIST CSF 2.0
DE.CM-01
Continuous monitoring of networks and network services for adverse events
The control's implementation example prescribes flow-versus-baseline comparison
MITRE ATT&CK
DC0078 Network Traffic Flow
Flow telemetry is this component's exact definition: records of connections and sessions
Feeds the flow-based detection strategies formalized in v18 and v19
MITRE ATT&CK
DC0085 Network Traffic Content
Packet and protocol content analysis, including payload-derived metadata
Underpins content-aware detection strategies where flow alone is insufficient
CIS Controls v8.1
Control 13
Network Monitoring and Defense is the control family for this entire practice
Safeguards span centralized alerting, intrusion detection, segment filtering, and port-level access control
NIS2
Directive (EU) 2022/2555
Network monitoring, incident detection, and reporting obligations for essential and important entities
Monitoring and detection are legal obligations in the EU, not recommendations
How network security analytics maps to the framework controls and components that codify it.
The EU picture: NIS2 and ENISA
The NIS2 Directive (EU 2022/2555) mandates network monitoring, incident detection, and reporting for essential and important entities, which makes network security analytics a direct regulatory driver in Europe rather than a discretionary investment. ENISA's Threat Landscape 2025, published October 2025 and covering 2024-07-01 to 2025-06-30 across 4,875 analyzed incidents, found that DDoS attacks accounted for 77% of reported EU incidents (ENISA Threat Landscape 2025). In a separate cut of the same dataset, ENISA attributed roughly 80% of reported incidents to hacktivist activity. Reporting obligations of that shape are simplest to meet when network telemetry and detection are already in place.
Modern approaches to network security analytics
The discipline is converging on behavior modeling across network, identity, and cloud telemetry, because signatures no longer survive encryption or native tooling. The evidence above explains the direction. Payload signatures fail against traffic that is overwhelmingly encrypted, and tool signatures fail against attackers using the operating system's own binaries. What stays durable is behavior, read across surfaces rather than in isolation. Cloud security analytics applies the same baselining discipline to the adjacent surface, control-plane and API telemetry, and mature programs treat the two as one continuous practice.
Judged as capability criteria rather than a vendor checklist, three things separate serious approaches: telemetry breadth that includes east-west traffic and agentless assets, detection quality that holds up under encryption, and signal-to-noise discipline a small team can live with. The last criterion is the SOC argument in miniature. Analysts drowning in low-context alerts do not lack data. They lack ranked signal, which is what actually moves mean time to detect (MTTD) and mean time to respond (MTTR).
How Vectra AI thinks about network security analytics
Vectra AI starts from an assume-compromise premise: a determined attacker will get in, often holding valid credentials and using native tooling that produces no malicious artifact for an endpoint agent to find. Detection therefore has to happen where attacker behavior is unavoidably visible, which is the network. The methodology models behavior rather than matching signatures, baselines every host and identity, and elevates the deviations that indicate an active attack in progress, so a security team investigates a short, ranked list instead of an alert queue.
Conclusion
Network security analytics needed a clean definition, and it has one: detection analytics applied to network telemetry, asking whether anything on the network is behaving like an adversary. The boundaries do the real work. It is not performance analytics, not a SIEM, and not any single product. It earns its place through what only the network can see: attackers operating on valid credentials, movement between internal hosts, encrypted channels, and devices that will never carry an agent. The frameworks now assume the practice, so treat adoption as a coverage question. Map the telemetry you already generate, baseline what normal looks like, and make deviation from that baseline the first thing your SOC investigates.
FAQs
How does predictive network analytics improve network management?
In a security context, predictive value means shorter detection latency. Behavioral models learn normal traffic and flag deviation early in an intrusion, before staging or exfiltration, which shrinks the window an attacker operates unobserved.
What are the key performance indicators (KPIs) in network analytics?
For security, the KPIs are mean time to detect, mean time to respond, dwell time, and false-positive rate. Latency and throughput are network performance metrics, not measures of detection effectiveness.
Does your company need security analytics?
Audit telemetry coverage rather than starting from products. If assets carry no endpoint agent, if east-west traffic goes unobserved, or if encrypted sessions pass uninspected, network analytics closes gaps no other telemetry covers.
What should you consider when selecting network analytics software?
Evaluate capability, not brand: telemetry breadth across east-west traffic and agentless devices, detection quality against encrypted and living-off-the-land activity, baseline transparency, and the signal-to-noise ratio your analysts will actually experience.
How do you improve security analytics accuracy?
Invest in baseline quality first: model each environment on its own traffic, tune detections to local patterns, and suppress known-good periodic services. Suppressing noise beats lowering sensitivity, which trades false positives for missed attacks.