Security telemetry: the data layer every detection is built on
Key insights
Security telemetry is the continuous stream of security-relevant data (metrics, events, logs, and traces) from endpoint, network, cloud, identity, and application sources.
The 2026 DBIR found the multi-domain System Intrusion pattern in 61% of breaches, up from 53%, making single-domain telemetry structurally insufficient.
Gartner projects that 40% of all log telemetry will be processed through a telemetry pipeline product by 2027, up from less than 20% in 2024.
MITRE ATT&CK deprecated its Data Sources model in v18 (October 2025), and v19 now pins telemetry tampering to T1685 under Defense Impairment.
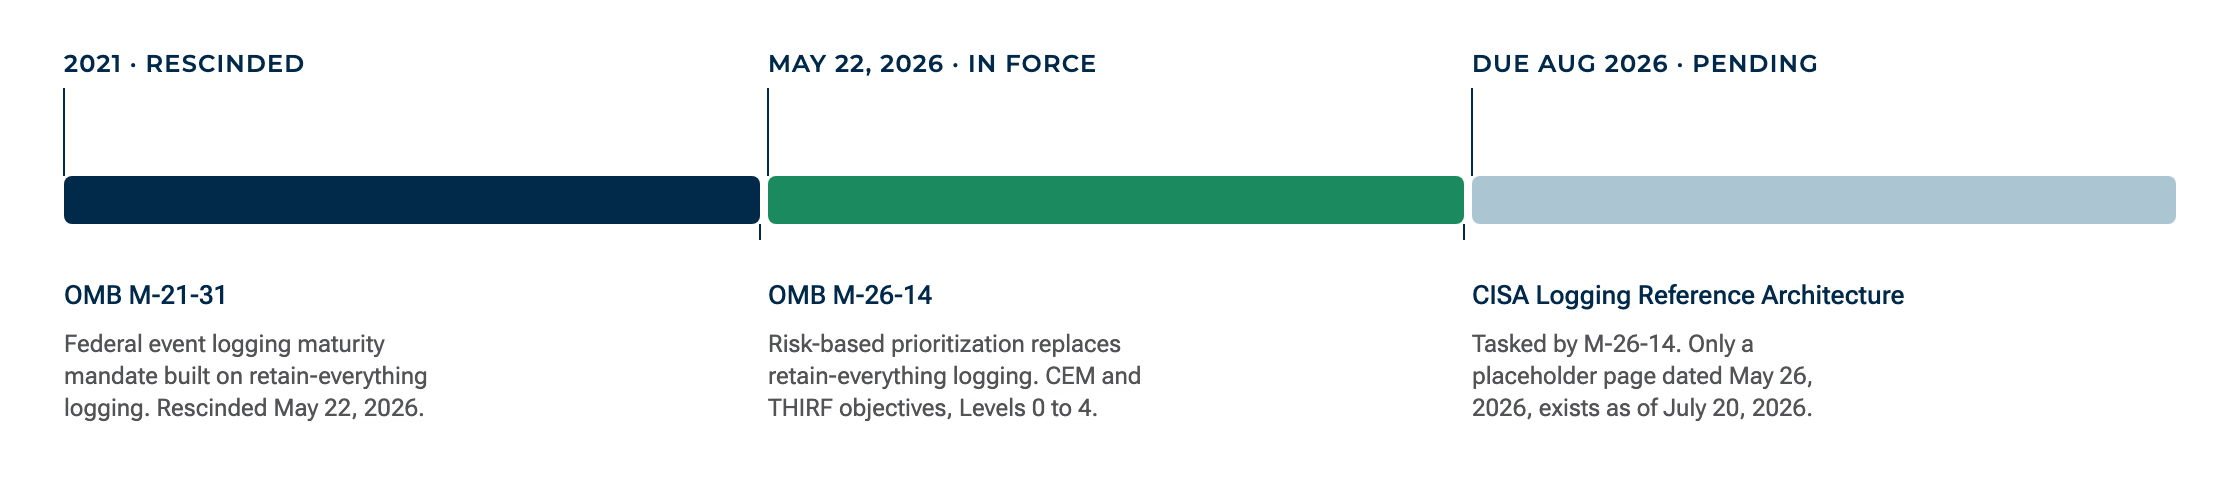
OMB M-26-14 (May 22, 2026) rescinded M-21-31 and replaced retain-everything logging with risk-based prioritization for US federal agencies.
Security telemetry is the continuous, automated collection and transmission of security-relevant data (logs, events, metrics, traces, flows, and metadata) from endpoints, networks, cloud services, identities, and applications to the systems that analyze it. It is the raw material every detection, hunt, investigation, and forensic reconstruction is built on.
That data layer has become a first-order design problem. Volumes keep climbing, attackers deliberately target the gaps, and regulators are rewriting what must be collected and kept. This guide explains the types and sources of security telemetry, how collection and normalization work, where blind spots come from, what the data costs to keep, and how frameworks from MITRE ATT&CK v19 to OMB M-26-14 shape the requirements.
What is security telemetry?
Security telemetry is an output rather than a product: the stream of signals that endpoints, network sensors, cloud platforms, identity providers, and applications emit as they operate. Collected and correlated, that stream becomes the evidence base for threat detection, and it caps everything downstream, because what was never collected can never be queried. The querying and investigation disciplines that run on top of this data layer, including security observability, are covered on their own pages.
Why does security telemetry matter?
Because modern intrusions cross domains, and the evidence rarely sits in one place. An attacker can phish an identity, pivot through the network, and stage data in a cloud service within a single incident. Single-domain telemetry is structurally insufficient for that reality, and the numbers say the multi-domain case is now the norm.
The strongest evidence is Verizon's 2026 Data Breach Investigations Report (DBIR), which covers incidents that took place between Nov 1, 2024, and Oct 31, 2025. The 19th edition was published on May 19, 2026 (2026 DBIR press release) and draws on more than 31,000 incidents and more than 22,000 confirmed breaches across 145 countries (2026 DBIR executive summary).
Within that dataset, the multi-stage System Intrusion pattern appeared in 61% of breaches, up from 53% and 36% in the two prior editions, and ransomware reached 48% of breaches, up from 44% (2026 DBIR executive summary). Attacks that touch several domains leave their evidence in several telemetry streams, or they leave it nowhere. That is the core case for treating telemetry as a portfolio rather than a single feed.
What is the difference between telemetry, logging, monitoring, and observability?
Start with the pair practitioners genuinely dispute. Some sources treat telemetry as a real-time stream and logging as after-the-fact record keeping, two related but distinct things. Others treat logs as one telemetry shape among several. The field is trending toward that second, superset reading: telemetry spans metrics, events, logs, and traces, and logging is the practice that produces one of those shapes. This page follows the superset reading and notes the debate where it matters.
Monitoring and observability sit above the data rather than inside it. Security monitoring is the ongoing practice of watching known signals for known attack and failure conditions, and cybersecurity monitoring extends that practice across the full environment. Observability describes what a team can do with the data layer: ask new questions without shipping new instrumentation first. Telemetry is the raw material all three consume, which the table below summarizes.
Concept
What it is
What it answers
Where it lives here
Telemetry
The continuous stream of security-relevant signals an environment emits
What raw evidence exists about activity in the environment
This entire page
Logging
The practice of recording discrete events, producing one telemetry shape
What happened, recorded event by event
Types and sources, plus retention economics
Monitoring
Watching known signals for known conditions and alerting on them
Is something known-bad happening right now
The security monitoring practice pages
Observability
The discipline of querying telemetry to explain unforeseen conditions
Why is this happening, including unknown unknowns
The security observability page
Telemetry is the data layer, logging produces one of its shapes, and monitoring and observability are practices built on top of it.
Types and sources of security telemetry
Security telemetry takes four common shapes and comes from at least five domains. No single shape or domain sees a whole attack, so coverage planning starts with a map of what each source can and cannot show.
The MELT taxonomy
The industry shorthand for telemetry's shapes is MELT: metrics, events, logs, and traces.
Metrics are numeric measurements sampled over time, such as authentication failures per minute on a VPN concentrator. They are compact and cheap to retain, which suits baselines and trend detection.
Events are discrete records of something happening at a point in time, such as a process launching or a firewall blocking a connection. Most detection logic runs on events.
Logs are timestamped records emitted by operating systems, applications, and services, from Windows event logs to cloud audit trails. They carry the richest context and the largest storage bill.
Traces follow a single request or transaction across distributed services. In security work they help reconstruct how one action propagated through connected systems.
Telemetry by domain
Endpoint and EDR telemetry. Process starts, file and registry changes, module loads, and script activity captured by host agents. It is the richest view of on-host behavior, and it exists only where an agent is installed and running.
Network telemetry. Flow records such as NetFlow and IPFIX, DNS queries, and TLS handshake attributes, typically extracted as metadata rather than full packets. Because sensors sit on taps and mirror ports instead of hosts, network traffic analysis sees unmanaged and transient devices that agent-based tooling cannot.
Cloud telemetry. Control-plane audit logs, flow logs, and workload signals from infrastructure and SaaS platforms. It is the system of record for cloud security, with one caveat developed later: providers filter or sample some log types by default.
Identity telemetry. Sign-in and audit records from directories, identity providers, SaaS applications, privileged access management, and federation services. Coverage must extend to non-human identities, including service accounts, API keys, and AI agents, which is the data foundation identity threat detection and response builds on.
XDR and MDR telemetry.XDR platforms correlate telemetry across several domains into unified detections, and MDR providers run their detection service on whatever telemetry a customer environment produces. Both consume the domains above rather than adding a new one.
Alert and inspection data rounds out the picture. Firewalls and intrusion detection and prevention systems emit verdicts and detections of their own, and they remain staple network security sources even though they observe rather than reconstruct behavior.
One surface is genuinely new. The 2026 DBIR found that 45% of employees are regular AI users on corporate devices, up from 15% a year earlier (2026 DBIR executive summary). Browser and AI-tool usage telemetry is becoming a first-class source as a result, because unsanctioned AI use concentrates exactly where traditional agents look least.
Domain
Representative sources
What it uniquely reveals
Common gap
Endpoint
EDR agents and operating system event logs
Process-level behavior on managed hosts
No agent means no data: unmanaged devices are invisible
Network
NetFlow and IPFIX, DNS, TLS metadata from taps and mirrors
Activity of every device that touches the wire, managed or not
Every management action and API call in the tenant
Provider-side filtering and sampling of some log types
Identity
Identity provider sign-ins, directory changes, privileged access and federation events
Which human or machine identity authenticated, from where, to what
Non-human identities often go unmonitored
Application
Audit trails, web server logs, web application firewall events
Business-logic abuse invisible to infrastructure layers
Inconsistent instrumentation across custom software
Five telemetry domains, what each uniquely reveals, and the coverage gap each leaves when used alone.
How security telemetry works
Raw signals become usable telemetry through a pipeline: collect, transmit, normalize, route, store, analyze. Each stage is a design decision, and several stages are attack surfaces in their own right.
Collection happens through agents on hosts, sensors on network taps and mirror ports, API polling against cloud and SaaS platforms, and streaming exporters built into modern software. Tap-based collection is notable because it is passive: a sensor observing a mirror port needs nothing installed on the endpoint, which gives defenders a channel attackers cannot easily reach from a compromised host. Transmission then moves data toward analytics with batching, buffering, and back-pressure so bursts do not silently drop events.
End to end, the flow looks like this:
Instrument sources with agents, sensors, exporters, and API integrations.
Collect events, metrics, logs, and traces continuously.
Transmit with batching, buffering, and back-pressure controls.
Normalize everything into one shared schema.
Route each stream to analytics, storage, or both.
Store by tier: hot, warm, and cold.
Analyze for detections, investigations, and hunts.
Six stages turn raw signals from every domain into normalized, tiered, and analyzable security telemetry.
Normalization is what makes telemetry from different producers joinable. The Open Cybersecurity Schema Framework (OCSF) gives security events a shared, vendor-neutral structure. OpenTelemetry standardizes how software is instrumented and how its metrics, logs, and traces are exported, and the project maintains dedicated security guidance for hardening its collector components. Elastic Common Schema (ECS) and the Common Information Model (CIM) pursue the same goal within their own ecosystems. All four are properties of what the data looks like once normalized, not analytics tools.
From there the data reaches an analytics tier. A SIEM correlates normalized telemetry against rules and behavioral models to produce alerts, and this page stops at its front door. The open-ended querying and investigation practice that runs on the same data layer belongs to the observability discipline, which owns that work.
Measuring the telemetry itself keeps the pipeline honest. Four measures dominate: coverage, meaning which detection-framework techniques your sources can evidence, ingest volume and its cost, latency from event generation to analysis, and completeness, meaning streams arrive without gaps or silent drops. Weak numbers on any of the four surface later as blind spots. Track them per source, not as one global average.
Security telemetry in practice
Three cases, spread across 13 years, show the difference between telemetry existing, telemetry being complete, and telemetry being acted on. Each also shows why analysts treat telemetry as evidence: it has to exist, cover the right surface, and reach someone or something that acts.
Hugging Face (2026): telemetry acted on. The company reported that its "anomaly-detection pipeline uses LLM-based triage over security telemetry to separate real signals from the daily noise, and it was the correlation of those signals that flagged the compromise" (Hugging Face disclosure). The account is self-reported by the breached party and asserts no intrusion timeline. It was disclosed on July 16, 2026, and drew wider neutral coverage on July 20 (Help Net Security). Reporting confirmed impact to internal datasets and credentials (TechCrunch).
SolarWinds SUNBURST (2020): telemetry incomplete. The supply-chain implant, publicly disclosed on December 13, 2020, disguised its command-and-control traffic as legitimate product telemetry and evaded endpoint controls (Mandiant SUNBURST analysis). Endpoint-only telemetry can be blind to activity riding trusted channels.
Target (2013): telemetry ignored. A March 26, 2014 US Senate Commerce Committee staff report found Target appears to have failed to respond to multiple automated warnings from the company's anti-intrusion software while attackers installed malware, before data left the network (Senate "Kill Chain" analysis). Detection capability without triage is not detection.
Dwell time measures the payoff, and it is moving the wrong way. M-Trends 2026, covering calendar year 2025 across more than 500,000 incident response hours, found global median dwell time rose to 14 days from 11, with cyber espionage and North Korean IT worker incidents running a 122-day median (M-Trends 2026). The prior edition, M-Trends 2025, covering calendar year 2024, is the source of that 11-day baseline. Closing the gap is less about more raw data than about coverage that feeds threat hunting between alerts and triage discipline that turns signals into incident response before dwell compounds.
Telemetry blind spots and how attackers exploit them
You cannot detect what was never recorded. Blind spots come in two categorically different failure modes: coverage gaps, where the event is never produced, and tampering, where it is produced and then suppressed. Both compound alert overload: SOC teams field more alerts than they can triage, and alert fatigue buries the few attacker signals under the far larger volume describing normal operations. The 2026 DBIR shows the cost of slow separation: median time to full resolution reached 43 days, and only 26% of critical vulnerabilities on CISA's Known Exploited Vulnerabilities list were fully remediated, down from 38% (2026 DBIR executive summary).
Coverage gaps: the data is never produced
Unmanaged, edge, IoT, and operational technology (OT) devices run no agents, so host telemetry from them does not exist. The 2026 DBIR, covering incidents through October 2025, found vulnerability exploitation rose to 31% of breaches, the most common initial access vector (2026 DBIR executive summary). The 2025 DBIR had already attributed 22% of vulnerability-exploitation actions to edge devices and VPNs (2025 DBIR). Provider-side filtering and sampling create the same kind of hole in cloud logs.
Identity telemetry fails silently too. Vendor threat research disclosed in July 2026 described OAuth client-ID spoofing in Entra ID environments: a spoofed client ID leaves the application-name field blank, so detections tuned to a named application can pass over the activity entirely (Help Net Security). One campaign tracked since December 2025 used more than 3.7 million spoofed application IDs against more than two million user accounts, probing credential validity "without generating a successful sign-in event" (The Hacker News). No ATT&CK technique ID covers this behavior: it is a coverage gap, not tampering, because nothing was ever written.
Tampering: the data is produced, then suppressed
Where telemetry is produced, attackers suppress it. MITRE ATT&CK v19 catalogs this as T1685 Disable or Modify Tools under the Defense Impairment tactic (TA0112): adversaries disabling or modifying defensive software itself, including EDR tools, IDS, antivirus, and logging agents and sensors, the arms race covered under EDR evasion. All six sub-techniques target the record or the analyst's view of it: disabling or modifying the Windows Event Log, cloud logs, or the Linux audit system log, modifying or spoofing a tool's UI, and clearing Windows event logs or Linux and Mac system logs.
The pressure is real. An industry threat report covering 2025 found roughly 82% of detections were malware-free, with a fastest recorded breakout of about 27 seconds. Intruders moving that fast on legitimate credentials and tools have every incentive to silence host telemetry.
The collection layer is itself software
The collection layer is software too. Two 2026 OpenTelemetry vulnerabilities, CVE-2026-40182, an unbounded response read in the .NET implementation that can exhaust memory (NIST CVSS 5.9), and CVE-2026-45287, a file descriptor leak in OpenTelemetry-Go that can cause denial of service, are both availability and resource-exhaustion issues. A crashed collector blinds everything downstream. The scores on the second also show why single-score triage is fragile: NIST rated it 5.5 under CVSS 3.1, while the CVE Numbering Authority rated it 2.1 under CVSS 4.0, so the same bug reads very differently depending on the feed.
Every compensating source in the table below shares one property: independence from the compromised host. When agents are absent, disabled, or lying, network telemetry from taps and mirrors is the record intruders cannot silence, the core argument for network visibility and network detection and response.
Blind spot
Why the data is missing
Attacker benefit
Compensating source
Unmanaged, edge, IoT, and OT devices
No agent can be installed, so host telemetry is never produced
Initial access and persistence with no on-host record
Network telemetry from taps and mirrors
Filtered or sampled cloud logs
Provider defaults omit or sample some log types
Activity in the gaps never reaches the SOC
Full audit tiers plus flow and identity correlation
Spoofed OAuth client IDs
No successful sign-in event is written at all
Application-keyed detections never fire
Behavioral baselines on accounts plus network egress telemetry
Log tampering (T1685)
Events are generated, then disabled, modified, or cleared
Post-intrusion actions vanish from the record
Real-time forwarding to systems attackers cannot reach
Collector outage or overload
The collection layer itself fails or is crashed
Everything downstream goes dark at once
Pipeline health monitoring and prompt collector patching
Five common telemetry blind spots, the failure mode behind each, and the compensating source that restores visibility.
The economics of security telemetry
Telemetry growth is now a budget line with security consequences. Cribl's Telemetry Trends report found core inputs (syslog, TCP, and TCP JSON) each expanding by more than 60% year over year across its April 2024 to April 2025 window (Cribl Telemetry Trends). Analytics-tier pricing is typically per gigabyte ingested, so growth lands directly on the SOC operations budget. Cost pressure then becomes a security problem in disguise: teams that drop sources wholesale to save money are buying a blind spot, not a saving.
A telemetry pipeline layer is the emerging answer. Gartner's Market Guide for Telemetry Pipelines, published September 2, 2025, projects that "By 2027, 40% of all log telemetry will be processed through a telemetry pipeline product, up from less than 20% in 2024" (Gartner Market Guide for Telemetry Pipelines). A pipeline sits between producers and destinations to ingest, process, and route: filtering noise, enriching records, reshaping schemas, and tiering each stream before anything reaches the analytics tier.
That analytics tier is usually a SIEM, and per-gigabyte SIEM ingest is the line item pipelines exist to protect. For directional market context, the syndicated aggregator Mordor Intelligence's SIEM market analysis sizes the market at USD 12.06 billion in 2026, reaching USD 20.78 billion by 2031, an 11.50% compound annual growth rate. The same analysis asserts, on its own authority with no independent primary, that organizations with more than 10,000 employees ingest over 10 terabytes of log data each day. Treat both as directional signals rather than precise measures.
Retention tiering is the other half of cost control. Keep live-detection data hot, investigation data warm, and compliance data cold, and decouple storage from the analytics engine so history stays queryable without hot-tier pricing.
Tier
Typical window
Primary use
Cost profile
Hot
Days to weeks
Live detection, triage, and correlation
Highest per gigabyte, fastest query
Warm
Weeks to months
Investigations and short-horizon hunts
Moderate, slower query acceptable
Cold
One to seven years
Compliance, audits, and retrospective scoping
Lowest, archive-class storage
Tiered retention matches each telemetry use to a storage class so coverage survives without hot-tier pricing for everything.
The strategy that ties it together is logging with intent: define detection goals first, map them to the telemetry those detections require, then tier everything else down or out. Practitioner guidance such as Security Blue Team's telemetry strategy guide frames the same discipline: every collection decision should trace to a detection or investigation purpose, not to habit.
Security telemetry, frameworks, and compliance
Telemetry requirements increasingly arrive from frameworks and regulators, and 2026 reset two key reference points.
Mapping telemetry to MITRE ATT&CK v19
Telemetry mapping inside MITRE ATT&CK changed twice in six months. Version 18, released October 28, 2025, deprecated the legacy "Data Sources" component in favor of Detection Strategies (DET) and Analytics (AN) (MITRE ATT&CK October 2025 release notes). Version 19, released April 28, 2026, then split Defense Evasion into Stealth (TA0005) and Defense Impairment (TA0112) (MITRE ATT&CK April 2026 release notes). Legacy Data Source IDs such as DS0029, DS0038, and DS0002 still circulate in practitioner content, but they are historical identifiers from a deprecated model, not current guidance. For detection engineering teams, coverage mapping now starts from Detection Strategies and the analytics under them, each naming the telemetry it needs.
OMB M-26-14 and the 2026 federal logging reset
OMB Memorandum M-26-14, dated May 22, 2026, states: "Effective immediately, OMB Memorandum M-21-31 is rescinded." Risk-based prioritization replaces retain-everything logging, organized around two objectives: Continuous Event Monitoring (CEM) and Threat Hunting, Investigation, Response, and Forensics (THIRF). The maturity model has five levels, Level 0 Ineffective through Level 4 Optimal, and the memo itself labels Level 1 inconsistently: "Basic" in its compliance-deadline table, "Initial" in Appendix C. Scope covers US federal civilian systems, explicitly including IoT and OT, and excludes national-security, Department of Defense, and intelligence community systems.
The memo tasks CISA with a Logging Reference Architecture that remains unpublished as of July 20, 2026. The CISA resource page is a placeholder dated May 26, 2026, stating it will be updated when the LRA is complete, and the 90-day clock expires around August 20, 2026.
The 2026 federal logging reset rescinded M-21-31 and left the CISA reference architecture pending as of July 2026.
Standards and retention drivers
NIST SP 800-92, the foundational log management guide, dates to September 2006, and its Revision 1 draft closed public comment on November 29, 2023 without being finalized, so the 2006 original remains the baseline of record. NIST CSF 2.0 grounds telemetry in its Detect function under the DE.CM Continuous Monitoring category. OWASP renamed A09:2021 "Security Logging and Monitoring Failures" to A09:2025 "Security Logging and Alerting Failures," keeping it at #9. The CISA Zero Trust Maturity Model names Visibility and Analytics as one of its cross-cutting capabilities.
Retention obligations come from a broader set. PCI DSS, GDPR, NIS2, HIPAA, and SOC 2 all drive how long telemetry is kept, and compliance reporting consumes the archived tiers, a useful reminder that M-26-14 is US federal policy while these drivers travel globally.
Framework
Reference
How telemetry maps
Status/date
MITRE ATT&CK v19
Detection Strategies (DET) and Analytics (AN)
Each analytic names the telemetry needed to evidence a technique
v19 released April 28, 2026; Data Sources deprecated in v18.0 (October 28, 2025)
OMB M-26-14
CEM and THIRF objectives, five-level maturity model
Risk-based collection, monitoring, and retention for US federal agencies
Issued May 22, 2026; rescinds M-21-31
CISA Logging Reference Architecture
Tasked by M-26-14
Will detail federal logging architecture
Pending; placeholder page as of July 20, 2026
NIST SP 800-92
Log management planning guide
Baseline for log generation, storage, and disposal
September 2006; Revision 1 draft not finalized
NIST CSF 2.0
Detect function, DE.CM category
Continuous monitoring rests on telemetry coverage
Version 2.0, released 2024
OWASP Top 10
A09:2025
Logging and alerting failures as an application risk class
Renamed from A09:2021; stays at #9
CISA Zero Trust Maturity Model
Visibility and Analytics
Telemetry underpins zero trust visibility decisions
Version 2
How major frameworks and regulations reference security telemetry, with the version or status of each as of July 2026.
Modern approaches to security telemetry
The direction of travel is fewer, better signals from broader coverage. Four moves define the modern approach: pipeline-first architectures that filter and route before the analytics tier, open normalization schemas that keep data joinable and portable, decoupled storage that keeps history affordable, and AI-assisted triage that works the telemetry itself instead of adding another alert stream. For SOC operations teams, the test of any of them is whether the distance between raw signal and confident decision shrinks.
The newest telemetry surface is AI itself. The 2026 DBIR ranked shadow AI use as the third most common non-malicious insider action in its data loss prevention dataset (2026 DBIR executive summary), and AI agents and other non-human identities are becoming first-class telemetry producers and consumers. Coverage plans that stop at human users and managed hosts are already behind.
How Vectra AI thinks about security telemetry
Vectra AI starts from an assume-compromise stance: capable attackers will get in, so the defining question is how quickly their behavior surfaces in the data. Telemetry breadth across the modern network, spanning campus, data center, cloud, and identity, is necessary but not sufficient. The work that matters is turning that breadth into a small number of high-fidelity attack signals an analyst can act on with confidence.
FAQs
What is the difference between telemetry and logging?
Logs are one shape of telemetry rather than its opposite. Some sources frame telemetry as a real-time stream and logs as after-the-fact records, and both framings appear in practice. The field is trending toward the superset reading: telemetry spans metrics, events, logs, and traces (MELT), and logging is the practice that produces one of those shapes.
What is the difference between telemetry and observability?
Telemetry is the data: the continuous signals an environment emits. Observability is the discipline built on that data, including querying it to explain conditions nobody anticipated. This page owns the data layer itself, while the security observability discipline, covered separately, owns the investigation and analysis workflows that consume it.
How long should security telemetry and logs be retained?
Match retention to three windows: the detection window (hot, days to weeks), the investigation window (warm, weeks to months), and the compliance obligation (cold, commonly one to seven years under drivers such as PCI DSS and HIPAA). For US federal agencies, OMB M-26-14 replaced retain-everything mandates with risk-based prioritization in May 2026.
How do you reduce SIEM ingestion costs from telemetry?
Filter, deduplicate, and route telemetry before it reaches the analytics tier, then tier retention so history is not priced as hot data. Gartner's September 2025 Market Guide projects that 40% of all log telemetry will be processed through a telemetry pipeline product by 2027 (Gartner). Controlling SIEM ingest cost is a primary driver of that shift.
What is OpenTelemetry and how is it used for security?
OpenTelemetry is an open standard for instrumenting software and exporting the metrics, logs, and traces it emits. For security teams it matters as a normalization and transport convention, a property of what the data looks like rather than an analytics capability. Its collector components are software in their own right and need the same patching and health monitoring as any other infrastructure.
How do attackers evade or tamper with security telemetry?
Attackers exploit two distinct failure modes. Coverage gaps mean the event is never produced, as with unmanaged devices or spoofed OAuth client IDs that write no sign-in record at all. Tampering means the data existed and was suppressed, cataloged by MITRE ATT&CK as T1685 under Defense Impairment. Independent channels, such as network-derived telemetry, compensate for both.
How is security telemetry measured?
Mature programs track four measures per source: coverage, meaning which detection-framework techniques the source can evidence, ingest volume and its cost, latency from event generation to analysis, and completeness, meaning streams arrive without gaps or silent drops. Together they show where visibility is thin before an incident proves it.