Security observability explained: from monitoring's known-unknowns to high-cardinality querying
Key insights
Security observability is the discipline of asking arbitrary, unanticipated questions of rich, high-cardinality telemetry to surface unknown-unknowns — going beyond monitoring's predefined alerts and dashboards (known-unknowns).
Monitoring, observability, and visibility are complementary, not interchangeable: monitoring watches predefined signals, visibility is the data-source layer, and observability is the analytics discipline that queries all telemetry to ask why.
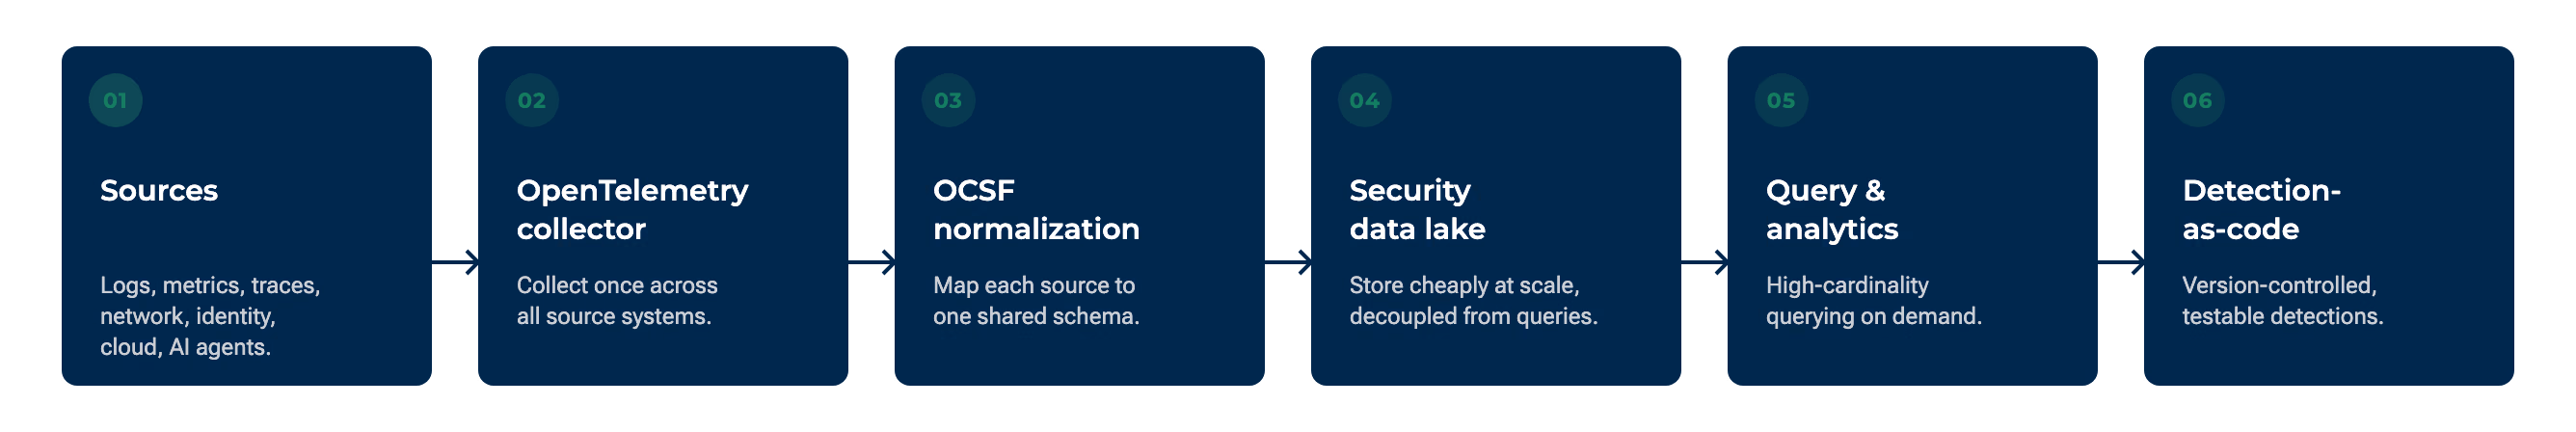
The modern architecture collects with OpenTelemetry, normalizes with the Open Cybersecurity Schema Framework (OCSF), stores in a decoupled security data lake, and queries on demand — making detection-as-code and high-cardinality analysis possible.
Predefined detections are structurally incomplete: enterprise SIEMs cover only 21% of MITRE ATT&CK techniques (CardinalOps, June 2025), which is precisely why exploratory, high-cardinality querying matters.
Observability now extends to AI agents — prompts, tool calls, and traces — because mean AI-agent monitoring coverage is just 52%, leaving 48% of agents running unsecured (Gravitee, 2026).
Security observability is the discipline of instrumenting systems so security teams can answer arbitrary, unanticipated questions from rich, high-cardinality telemetry — surfacing the unknown-unknowns that predefined rules never anticipated. Where monitoring watches for known signals, observability lets you ask why, and ask questions no dashboard was built to answer.
That distinction matters because attackers rarely behave the way predefined detections expect. They blend legitimate credentials, novel tooling, and multi-step movement that no single threshold flags. The ability to interrogate existing telemetry — to ask a question you only thought of after an alert — is what turns "we got an alert" into "we can reconstruct exactly what the attacker did." This guide explains what security observability is, how it differs from monitoring, visibility, and SIEM, the telemetry pillars it draws on, the modern data architecture behind it, and where the discipline is heading with detection-as-code and AI-agent observability. It builds on the broader security monitoring umbrella that most SOCs already run.
What is security observability?
Security observability is the discipline of instrumenting systems so that security-relevant, arbitrary, and unanticipated questions can be answered from rich, high-cardinality telemetry — surfacing unknown-unknowns — rather than relying only on monitoring's predefined signals, dashboards, and alerts, which answer known-unknowns.
The term has academic roots as well as operational ones. Researchers have framed observability as a way to strengthen the security architecture of complex digital ecosystems, treating the questions you can ask of a system as a measure of how defensible it is (arXiv). In practice, the discipline borrows from site reliability engineering, where observability describes how well you can understand a system's internal state from the data it emits. Observability in cybersecurity applies that same property to security questions: how completely, and how flexibly, can you interrogate your telemetry to understand what an adversary did?
The distinction from monitoring is the whole point. Monitoring answers known-unknowns — questions you anticipated and built alerts for in advance. Observability answers unknown-unknowns — the questions you did not think to ask until an incident forced them. A monitoring system is only as good as the rules someone wrote yesterday; an observable system stays useful for the questions you invent tomorrow.
Why observability matters in cybersecurity
Monitoring is built around questions you already know to ask. You define a threshold — failed logins per minute, outbound bytes per host, a known malware hash — and the system alerts when that threshold trips. This works well for known-unknowns: problems you anticipated and instrumented for in advance. The catch is that an alert tells you only that something happened, not why it happened or what else the same actor touched.
The trouble is that sophisticated attacks are, almost by definition, the things you did not anticipate. A novel living-off-the-land technique, a multi-step path that looks benign at each individual hop, or a credential abuse pattern that no single signal flags will slip past predefined rules. This is the core argument for security observability: when telemetry is rich and queryable enough, an analyst can ask a brand-new question — "show me every process that wrote to this directory and then made an outbound connection to a new region" — without having pre-built a rule for it. That ability to interrogate the unknown is how observability surfaces novel and multi-step attacks across a sprawling attack surface.
There is a second payoff: speed and certainty during investigation. When every relevant signal is queryable in one place, an analyst can pivot from a single indicator to the full story in minutes rather than days — confirming scope, ruling out false leads, and reconstructing the timeline. That is the difference between knowing an alert fired and knowing exactly what an attacker did, which is why observability has become a defining capability of the modern security operations center.
Crucially, security observability is a generic discipline, not any single vendor's feature. The definition above stays deliberately vendor-neutral: it is about the property of a system and the practices a team adopts, not a product category.
Security observability vs monitoring, visibility, and SIEM
Monitoring tells you that something is wrong; observability lets you ask why — and ask questions no rule anticipated. These terms are often used loosely, so it helps to treat each contrast rigorously, because the distinctions drive real architecture and staffing decisions. Observability does not compete with security monitoring; it extends it.
A useful analogy comes from medicine. Monitoring is like a vital-signs monitor that beeps when a number leaves a safe range — it tells you that a patient is in distress. Observability is the diagnostic workup that lets a clinician investigate why, following symptoms wherever they lead, including down paths no one anticipated. Both matter; neither replaces the other.
The differences fall into four areas: scope (predefined signals versus arbitrary questions), analysis (thresholds versus exploration), problem-awareness (known-unknowns versus unknown-unknowns), and capability depth (alerting versus investigation). The table below summarizes how monitoring, observability, and visibility relate.
Dimension
Monitoring
Observability
Visibility
Core question
Is a known signal out of range?
Why is this happening, including questions I did not predefine?
What data can I see and collect?
Problem type
Known-unknowns
Unknown-unknowns
Data availability
Method
Thresholds, dashboards, alerts
Arbitrary, high-cardinality querying
Instrumentation and collection
Layer
Predefined-signal layer
Analytics discipline
Data-source layer
Table: How monitoring, observability, and visibility differ — monitoring watches known signals, observability queries everything, and visibility supplies the underlying data.
Is monitoring a subset of observability?
The cleaner framing is that they are complementary properties rather than one being a strict subset of the other. Monitoring is the predefined-signal layer — the act of watching specific metrics. Observability is the property of a system that makes arbitrary questions answerable. Mature programs run both: monitoring catches the known fast, and observability handles everything monitoring cannot anticipate. Observability does not replace monitoring; it extends what a team can ask, so the right question is rarely "which one" but "how do they reinforce each other."
Observability vs visibility
Visibility is the data-source layer — what data you can actually see and collect from a given domain, such as the network. Network visibility, for example, is a data source; observability is the analytics discipline that queries it alongside every other telemetry stream. Put simply, visibility supplies the inputs, and observability is what you do with them. The packet, TAP, SPAN, and east-west collection mechanics that produce network data sit within network visibility; observability consumes that output as one input among logs, metrics, traces, identity, and cloud telemetry. You cannot have meaningful observability without visibility into the underlying data — but visibility alone, without the ability to query across it, leaves the hard questions unanswered.
Observability vs SIEM
Security information and event management (SIEM) systems centralize and correlate security data against predefined detection rules. Observability is the broader discipline of asking arbitrary questions of high-cardinality telemetry. Rather than a winner-take-all verdict, the relationship is best understood as a spectrum: observability can augment a SIEM, decouple cheap storage from the SIEM's analytics layer, or — in some cloud-native cases — replace a legacy SIEM entirely. Whether security observability is a viable SIEM alternative depends on an organization's cloud footprint, retention needs, and cost model, not on a one-size-fits-all answer. Many teams land in the middle: they keep the SIEM as a query and correlation layer while shifting bulk storage to a cheaper, decoupled tier so they can retain and interrogate far more telemetry than ingestion-priced indexing would allow.
The pillars of security observability
The three pillars — logs, metrics, traces — extend in security to events, detections, network flow, and identity and cloud telemetry. The canonical model from the broader observability world is exactly three: logs record what happened, metrics quantify how much and how often, and traces show how a request moved through a distributed system.
For security, that model is commonly extended into MELT — metrics, events, logs, and traces — which treats events as first-class. The three pillars remain canonical; MELT is the security-friendly extension, because discrete security events such as a detection firing, a policy change, or a privilege grant deserve first-class status rather than being buried inside general logs. A newer "wide events" critique argues that rich, high-cardinality event records may matter more than the rigid three-pillar split — a debate worth watching, but the pillars remain a useful on-ramp for teams new to the discipline.
The real value for security teams is extending each generic pillar into its security context, so that security signals become first-class observability inputs rather than afterthoughts. A log is not just an application message but an audit trail; a metric is not just a latency number but a failed-login rate; a trace is not just a performance map but a record of east-west movement an attacker might exploit. The table below maps each pillar to its security extension with an example signal.
Pillar
Security extension
Example signal
Logs
Security events, audit and identity logs, detections
A base64-encoded payload in a request header
Metrics
Rate-based security indicators
A spike in failed-login rate per account
Traces
Service-to-service and east-west movement
An unexpected east-west service hop
Table: The three observability pillars extended to security, with one example signal each.
What data sources feed security observability?
In practice, the inputs are broad. Application and system logs supply the raw record of activity; security events and detections add the discrete occurrences that matter most; network and flow telemetry capture how hosts and services communicate; identity and audit logs show who did what; and endpoint and cloud telemetry round out the picture across workloads. Behavioral signals — the foundation of network anomaly detection — are especially valuable because they describe how entities actually behave rather than matching a known-bad list, which is what makes them effective against novel techniques. The defining trait across all of these feeds is that they are treated as queryable telemetry, not siloed alert streams, so an analyst can correlate across them on demand instead of pivoting between disconnected consoles. The goal is one logical body of telemetry that any question can reach, regardless of which tool originally produced the data.
How security observability works: the modern data architecture
Modern security observability collects with OpenTelemetry, normalizes with OCSF, stores in a decoupled data lake, then queries on demand. Understanding this pipeline is what separates a buzzword from a working capability, and it is the layer that most clearly distinguishes observability from the monitoring and visibility disciplines around it.
The stages work as follows:
Collection. OpenTelemetry (OTel) is the open standard for collecting telemetry — logs, metrics, and traces — across heterogeneous systems. It graduated from the Cloud Native Computing Foundation (CNCF) on 21 May 2026 and has grown to more than 12,000 contributors from over 2,800 companies, cementing its status as the de facto open-source observability standard (CNCF, OpenTelemetry security docs). Extended Berkeley Packet Filter (eBPF) is a complementary kernel-level mechanism that captures rich system and network telemetry with low overhead, often feeding the same pipeline.
Normalization. The Open Cybersecurity Schema Framework (OCSF) maps telemetry from many vendors into one vendor-agnostic schema, so a login event means the same thing regardless of its source (OCSF). OCSF shipped v1.8.0 (changelog dated 16 March 2026), which added an ai_operation profile for modeling AI workloads as first-class security telemetry (OCSF release log). The standard also received support from member states of the International Telecommunication Union (ITU) in December 2025, toward ratification as an international standard by June 2026 (AWS open-source blog).
Storage. Modern architectures decouple storage from analytics, landing raw telemetry in a low-cost object-store security data lake rather than an expensive ingestion-priced index. A security data lake holds high-cardinality data cheaply and at scale, with the analytics engine acting as a query layer over it (Software Analyst market guide).
Query and analytics. With data normalized and stored, analysts and detection engineers run arbitrary queries — the heart of observability.
Detection-as-code. Detections are then expressed as version-controlled, testable code deployed through the same pipeline.
Schema-on-read and decoupled storage
The shift that makes this work is schema-on-read. Traditional SIEMs apply schema-on-write — they structure and index data at ingestion, which is rigid and expensive. Schema-on-read instead applies structure at query time, so teams can store raw, high-cardinality telemetry inexpensively and interpret it flexibly later. This is the only cost lens in scope here: rather than the build-versus-buy delivery economics covered under cybersecurity monitoring delivery models, observability's cost question is the storage-versus-analytics and retention tradeoff. A security data pipeline platform sits between collection and storage to route, enrich, and reduce telemetry before it lands.
Reducing cloud blind spots
Cloud-native environments — ephemeral containers, Kubernetes workloads, short-lived identities — generate exactly the high-cardinality, fast-changing telemetry that threshold monitoring struggles with. This is where observability earns its keep, and it connects directly to cloud security. The barriers are real: in the SANS 2025 Detection & Response Survey, 58% of respondents cited limited cloud expertise and 53% cited multicloud complexity as top cloud challenges (SANS survey coverage). Because cloud telemetry is high-cardinality and ephemeral by nature, observability reduces blind spots by keeping that data queryable after the workload is gone. Note that the security data pipeline landscape and OpenTelemetry's generative-AI conventions evolve quickly, so architecture decisions should be revisited periodically.
Detection-as-code and high-cardinality analysis
Detection-as-code version-controls detections like software; high-cardinality querying surfaces the attacks predefined rules never anticipated. Together, they connect the observability discipline to day-to-day practitioner workflow.
Detection-as-code applies the infrastructure-as-code philosophy to detections. Instead of clicking rules into a console, teams write detections as code that is:
Version-controlled, so every change is tracked and reviewable.
CI/CD-deployed, so detections ship through a tested pipeline.
Testable, so a detection is validated against known samples before production.
Portable, so logic is not locked into one tool's proprietary format.
This is the engineering backbone of modern detection engineering, and it pairs naturally with threat hunting, where analysts use exploratory queries to find what no rule has yet captured. Both feed broader threat detection outcomes.
What is high-cardinality data?
High-cardinality data is telemetry with many unique values — user IDs, container IDs, session tokens, source IPs. High cardinality is what makes arbitrary querying possible: when you can slice telemetry by any of thousands of unique attributes, you can ask a question you only just thought of. "Wide events" — rich records carrying many attributes per event — are the format that keeps high-cardinality questions answerable. This is precisely how observability helps detect unknown threats: the queryability lets analysts pose questions no predefined rule encoded.
Why predefined detections are inherently incomplete
The case for exploratory observability is grounded in hard data. Enterprise SIEMs cover roughly 21% of MITRE ATT&CK techniques, missing 79%, despite running infrastructure that could theoretically detect more than 90% of techniques (CardinalOps, June 2025; Help Net Security coverage). The same research found that 13% of detection rules are broken on average, a 5% decrease from 2024. The takeaway is not "your monitoring is failing" — it is that predefined detections are structurally incomplete, so you need high-cardinality observability to ask the questions rules never anticipated. MITRE ATT&CK is the yardstick here: observability's value is querying across techniques such as Discovery (TA0007) and Network Service Discovery (T1046) that predefined coverage misses (MITRE ATT&CK).
Two illustrative use cases
The Log4Shell vulnerability (CVE-2021-44228) is a durable methodology illustration of observability data as an investigation source. Analysts who spotted suspicious Java child processes were able to reconstruct the exploit path using application performance monitoring traces — a backend service appearing briefly in the service map — together with application logs showing base64-encoded payloads in request headers, confirming vulnerable libraries (CISA AA21-356A). This case is a dated 2021 methodology example, not a current statistic, but the lesson endures: unified telemetry turns an alert into a full reconstruction.
A more current pattern is cloud-native lateral movement from a leaked credential. A single signal — one failed login, one network connection — looks unremarkable. Observability surfaces the breach by correlating failed login, unusual network traffic, file-access patterns, and reads from an unusual region into one high-cardinality query. That correlation is how observability improves incident-response times and supports proactive threat detection: it catches multi-step attacks that threshold monitoring on any single signal would miss. A 2026 incident-response analysis of more than 750 incidents by the Unit 42 research team makes the same point — investigators often had to stitch together data from disconnected sources, slowing detection, and the report linked 90% of breaches to misconfigurations or security gaps (PR Newswire).
AI and agent observability
Observability for AI extends the pillars to prompts, tool calls, and traces — because 48% of AI agents run unmonitored. This is the freshest extension of the discipline, and it is moving fast.
AI agent observability means extending the observability pillars to AI-native signals: prompts, tool calls, retrieval provenance, token and turn metrics, the permissions in effect during an action, and end-to-end traces of an agent's reasoning and actions. Observability for AI systems is the same idea applied to any probabilistic AI component, not just autonomous agents.
The reason it requires new telemetry is that probabilistic AI systems break the deterministic assumptions monitoring depends on. An attack against an AI agent can succeed silently — manipulating the agent into a harmful action — without ever tripping a standard error metric or latency threshold. Only AI-native telemetry makes it possible to attribute what the agent did, why it did it, and which tools and permissions were involved, so a defender can reconstruct the incident afterward.
The exposure is significant. Roughly 80% of the Fortune 500 ran active AI agents as of February 2026. Yet mean AI-agent monitoring coverage stood at just 52% — leaving 48% of agents running unsecured (Gravitee, 2026). To instrument an AI agent for observability, teams typically capture:
Prompts and responses, including system prompts.
Tool and function calls, with arguments and results.
Retrieval provenance — which documents or data informed an answer.
Token and turn metrics across a conversation.
The identity and permissions in effect for each action.
Standards and regulation are catching up. OCSF's ai_operation profile (v1.8.0, March 2026) gives AI workloads first-class schema coverage (OCSF release log). NIST launched its AI Agent Standards Initiative on 17 February 2026, which includes research into AI agent security and identity (NIST), and the related NIST COSAiS project is developing SP 800-53 control overlays for securing single-agent and multi-agent AI systems (NIST COSAiS). Because these figures and standards are evolving rapidly, expect them to shift within roughly six months and date-stamp any claims you reuse.
Modern approaches to security observability
Mature security observability climbs from monitoring to correlated, high-cardinality, AI-assisted detection — integrating with, not replacing, the existing stack. Knowing where the discipline is heading helps teams plan a realistic path.
The common implementation challenges are consistent: ingestion-based billing makes large-scale collection expensive, cloud-native environments create blind spots, and false-positive overload drowns analysts — 73% of practitioners cited false positives as their top detection challenge in the SANS 2025 survey (SANS survey coverage). The vendor-neutral best practices that address these are equally consistent: start with a deliberate data-collection strategy and clear baselines before chasing tooling; instrument for high cardinality so arbitrary questions stay answerable; and integrate with the existing SIEM and endpoint stack rather than rip-and-replace, treating observability as the analytics layer over unified telemetry. Where the reader's next question is delivery economics or posture, those belong to adjacent disciplines — security posture management for posture, and delivery models for build-versus-buy.
On compliance, comprehensive logging and detection map cleanly to recognized frameworks: NIST CSF 2.0 functions including DETECT (DE.CM continuous monitoring and DE.AE adverse-event analysis), RESPOND, and IDENTIFY, while GDPR, HIPAA, PCI DSS, SOX, and NIS2 drive audit-logging and retention requirements (NIST Cybersecurity Framework). This is a callout, not a catalog — the full framework taxonomy lives under security frameworks.
A security observability maturity ladder
Teams can place themselves on a simple five-rung ladder, which doubles as a way to measure how security observability is progressing:
Monitoring — predefined alerts on known signals.
Centralized logging — telemetry aggregated in one place.
Correlated telemetry — signals joined across data sources.
Exploratory, high-cardinality observability — arbitrary querying at scale.
Vectra AI treats observability as the foundation of resilience — the combination of observability, signal, and action. That means coverage across the modern attack surface so attacker activity has nowhere to hide, AI-driven signal that prioritizes real attacks over noise, and informed action that turns findings into response. The emphasis is on methodology, not tooling: rich telemetry only creates resilience when the signal it produces is clear enough to act on with confidence.
FAQs
What is the difference between security observability and SIEM?
A SIEM centralizes and correlates security data against predefined detection rules; security observability is the broader discipline of asking arbitrary, unanticipated questions of high-cardinality telemetry. The relationship is best seen as a spectrum: observability can augment a SIEM, decouple cheap storage from the SIEM's analytics layer, or in some cloud-native cases replace it. The right balance depends on an organization's cloud footprint, retention needs, and cost model.
What is the MELT framework?
MELT stands for metrics, events, logs, and traces — a four-type model that extends the canonical three pillars (logs, metrics, traces) by treating events as first-class. The events pillar matters especially for security, where discrete occurrences like a detection firing or a privilege change carry weight. The three pillars remain canonical; MELT is the security-friendly extension.
Does observability replace monitoring?
No. Monitoring and observability are complementary rather than competing: monitoring is the predefined-signal layer that answers known-unknowns, and observability is the arbitrary-query property that surfaces unknown-unknowns. Mature programs run both, using monitoring to catch known issues fast and observability to investigate everything monitoring cannot anticipate.
What is schema-on-read in security data?
Schema-on-read applies structure to telemetry at query time rather than at ingestion, which is what schema-on-write does. This lets teams store raw, high-cardinality data cheaply and interpret it flexibly later, rather than locking it into a rigid format up front. It pairs with decoupled storage to keep arbitrary questions answerable at low cost.
What challenges do organizations face when implementing security observability?
The common challenges are ingestion-based billing cost pressure, cloud-native blind spots, and false-positive overload — 73% of practitioners cited false positives as their top detection challenge in the SANS 2025 survey. The best-practice response is to begin with a clear data-collection strategy and baselines, then integrate with existing tools rather than rip-and-replace. Treating observability as the analytics layer over unified telemetry keeps cost and complexity manageable.
How does observability help detect unknown threats?
Because high-cardinality telemetry lets analysts ask questions no predefined rule anticipated, observability surfaces unknown-unknowns — novel and multi-step attacks. This is why the finding that enterprise SIEMs cover only 21% of MITRE ATT&CK techniques (CardinalOps, June 2025) matters: exploratory querying fills the gaps predefined detections leave open. The queryability is the capability that turns existing data into new answers.
What is AI agent observability?
AI agent observability extends the observability pillars to AI-native signals — prompts, tool calls, retrieval provenance, token and turn metrics, and end-to-end traces — so teams can attribute and reconstruct an agent's behavior. It matters because mean AI-agent monitoring coverage is just 52%, leaving 48% of agents unmonitored (Gravitee, 2026). Probabilistic AI systems break deterministic monitoring assumptions, so AI-native telemetry is required to investigate silent agent compromises.