

An accurate and well-scoped threat model is necessary to ensure that organization detection capabilities are effective against realistic and relevant adversary behaviors. Prioritizing behaviors that are used by adversaries will have the broadest impact on an organization’s security posture by addressing the most prevalent threat techniques likely to be encountered, and thus detect attacks much earlier before damage is done.
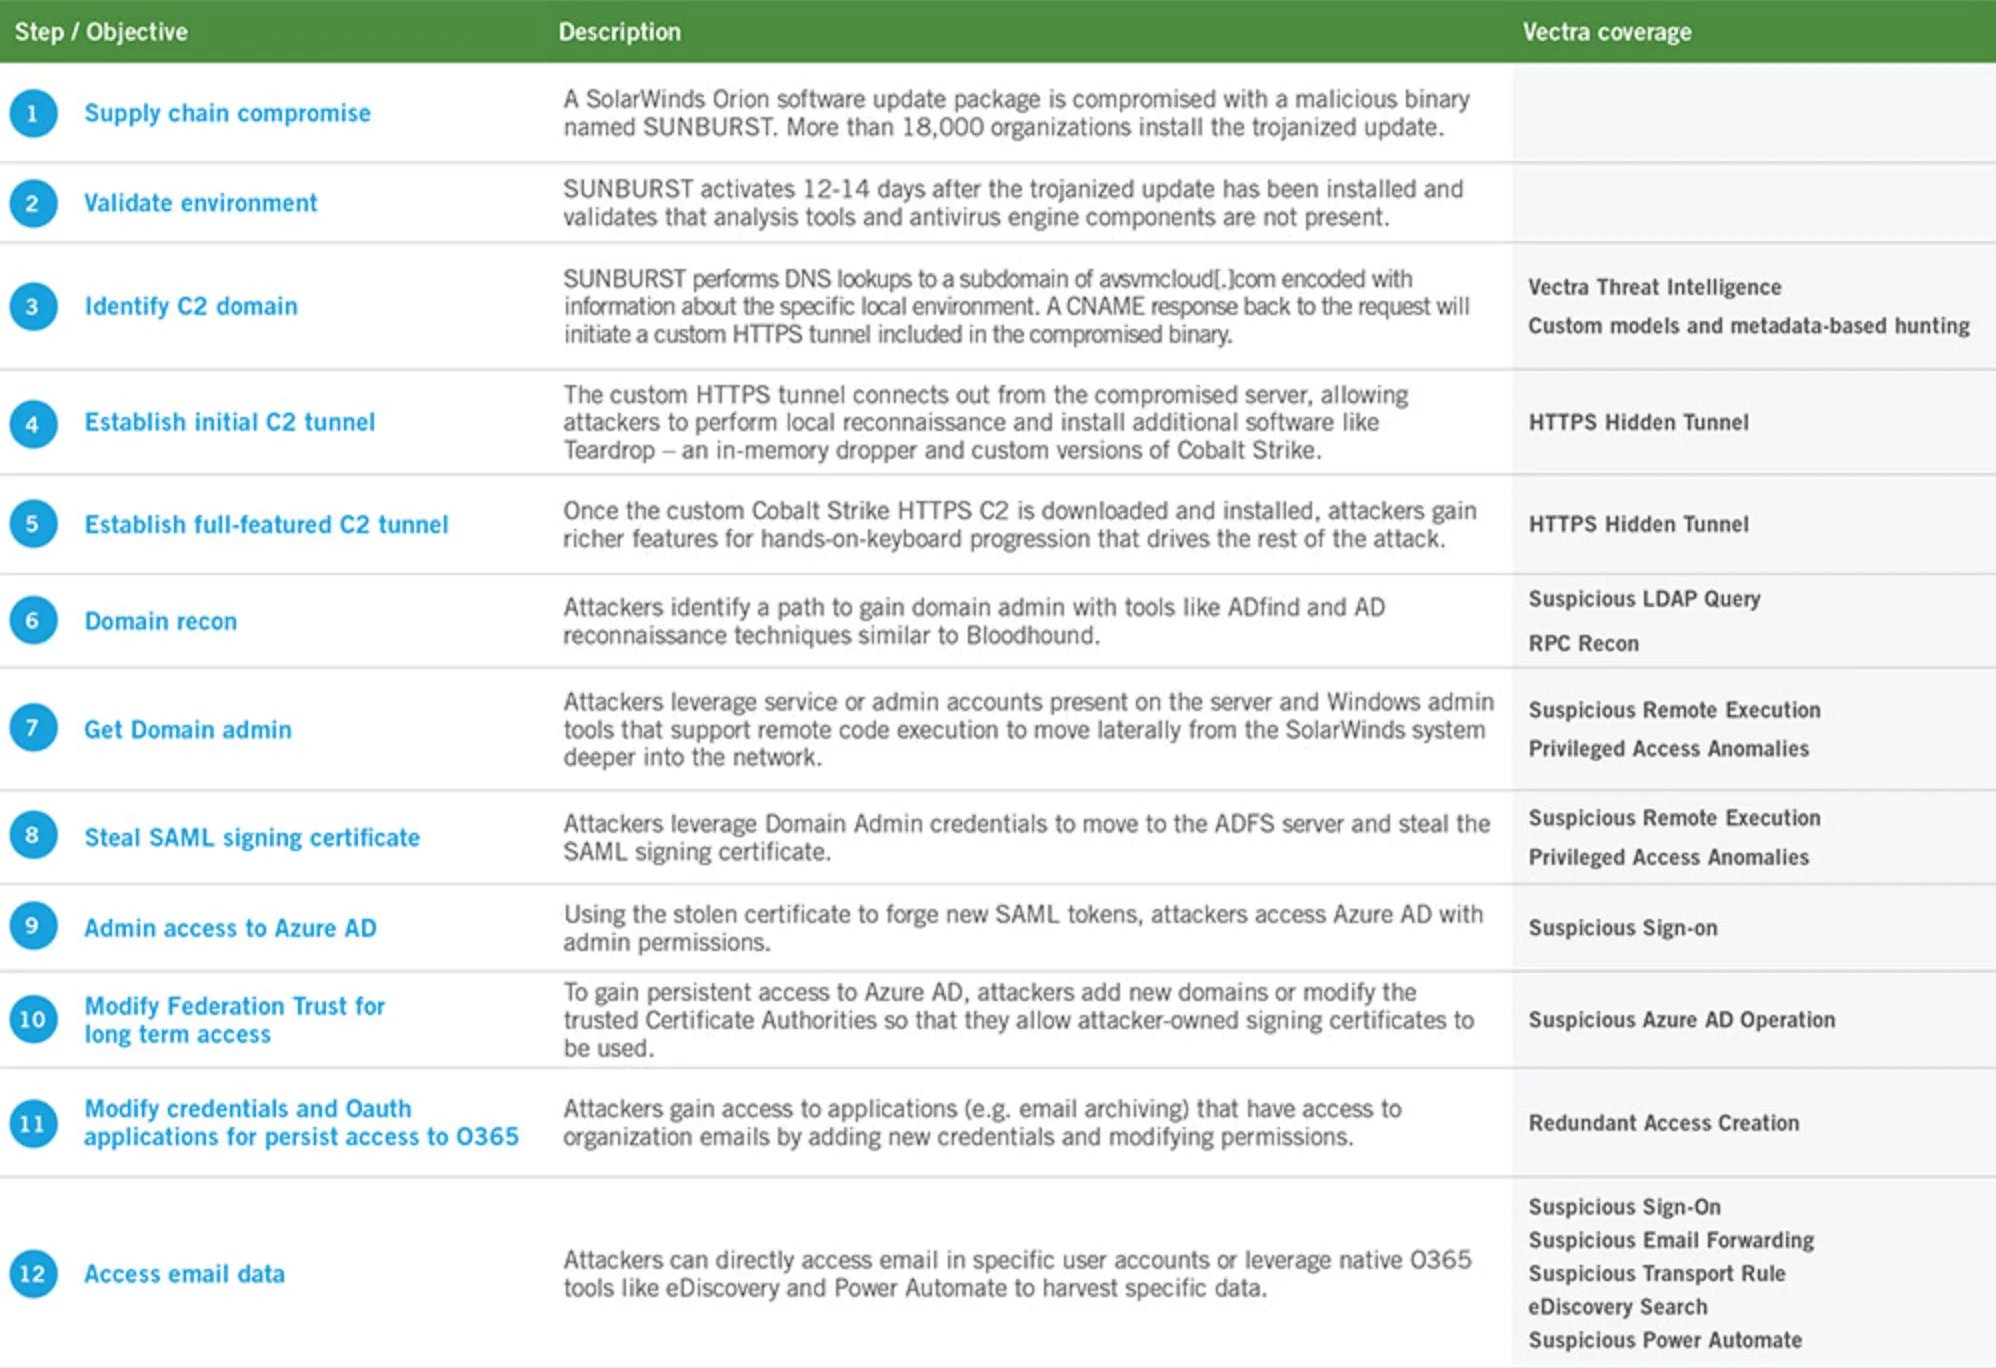
The objective of the SUNBURST attack was to establish a continuous and undetected command and control (C2) channel by the attackers to a trusted and privileged infrastructure inside the data center—SolarWinds. This would provide attackers with an initial privileged account as well as a pivot point to carry the attack forward.
Vectra researchers have dissected the SolarWinds supply chain compromise from the initial backdoor to the establishment of persistent access in the data center and cloud environments. A specific focus is provided for Microsoft Office 365, which appears to have been a key target of the attacks.
Subsequently, we have also identified trends of internal movement behaviors by analyzing cloud and network metadata generated by Vectra customer environments. This data allows us to quantify the volume and frequency of behaviors whether benign, suspicious or malicious and intentional, inside organizations across multiple industries and geographies. Combining occurrence of behaviors with techniques and tactics used in attacks like SUNBURST provides a better understanding of attack behavior patterns that represent the greatest risk to an organization.
Analyzing the behavior of SUNBURST & SolarFlare
Vectra researchers analyzed cloud and network metadata from October to December 2020 for frequency of occurrence per week and found all the behaviors used in the SUNBURST attack were present across all industries. Every industry has a profile of network and user behaviors that relate to specific business models, applications, and users. Through careful observation, adversaries can mimic and blend-in with these behaviors, making them difficult to expose.
Adversaries attempt to hide their presence in the noise and complexity of their target’s environment by using legitimate mechanisms and camouflaging malicious tactics in normal network traffic and user activity. This gives the adversary plenty of time to achieve those goals long before their presence is known, as evidenced by the fact that SolarWinds was first access on September 4th, 2019 and more than 1 year later, on December 12, 2020 they were notified of the breach.
While the occurrence of behaviors does not reflect a compromise, they do show that the behaviors can and do occur inside organizations today.
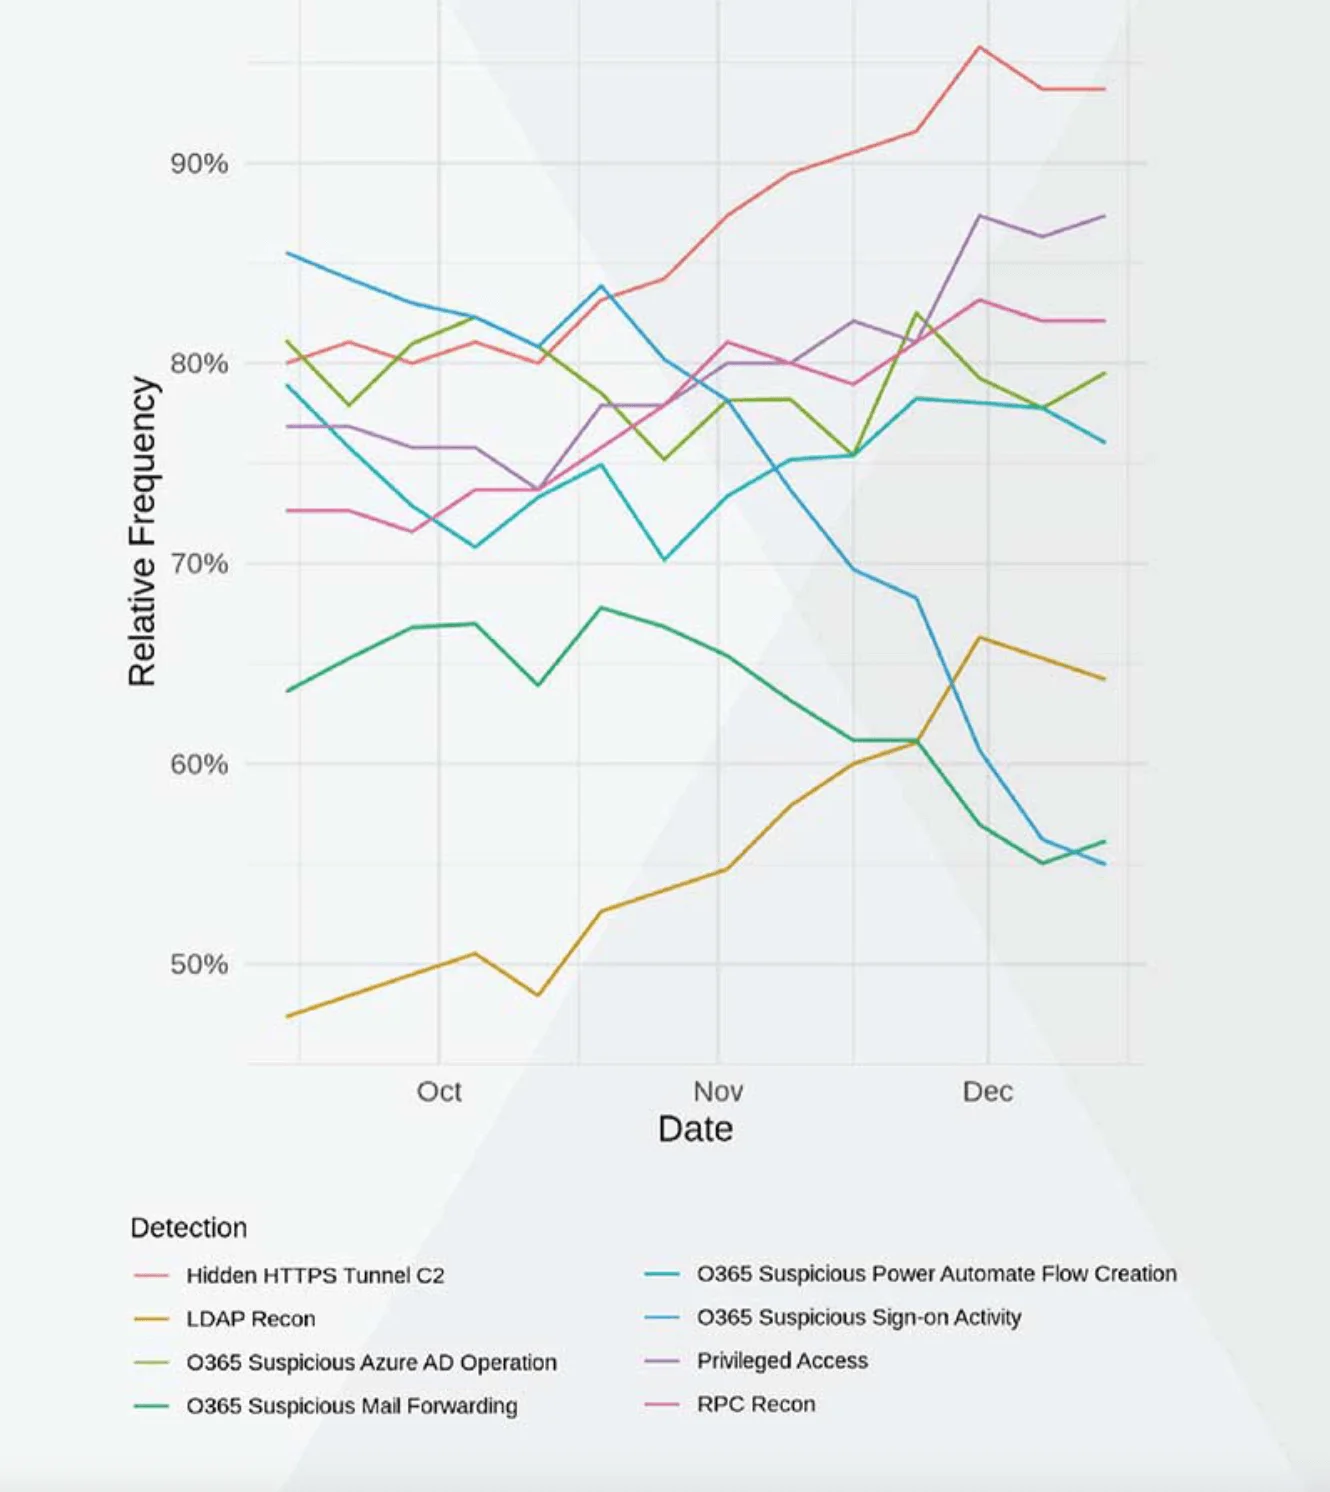
Figure 2 provides details on the percentage of organizations in which behaviors aligned with the SUNBURST attack lifecycle have occurred at least once a week across the three-month period of October - December 2020. Examining behavior data across a broad set of organizations over time makes it possible to predict future frequencies and rates of occurrence. Overall, every behavior except three trended upward by the end of 2020. It is reasonable to expect the trending of these behaviors to continue holding or rising into 2021 without further intervention or change within the organizations.
For example, almost all organizations monitored experienced some form of Hidden HTTPS C2 activity in mid-December also opposed to only 80% in early October. This is an alarming upward trend. There are many types of legitimate tunnels that financial services and other companies use to share data within networks or between applications. They often serve as modes of communication that bypass security controls for greater efficiency. Unfortunately hidden tunnels used by an adversary for C2 look similar and serve a different purpose.
Putting behavior into context
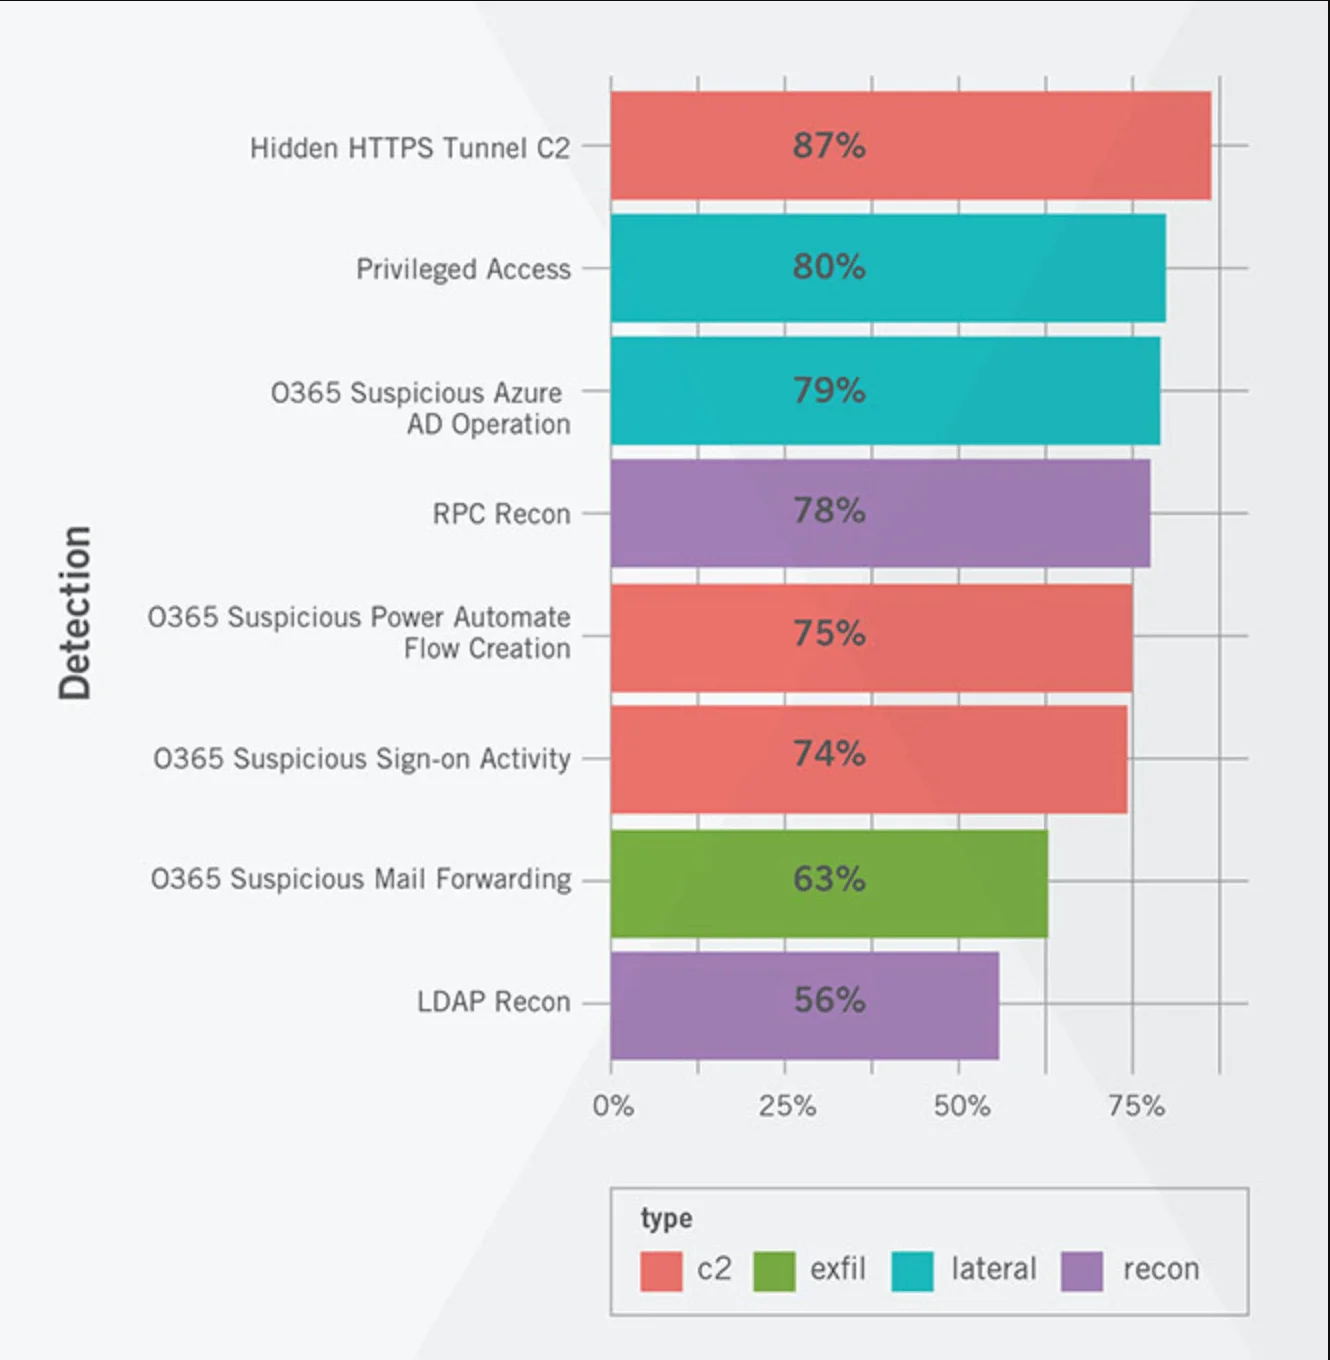
Assessing the impact of a behavior means understanding at what stage that behavior is most likely to occur. Figure 3 provides the weekly average of occurrence of each behavior and its related stage in the attack lifecycle. A high average frequency of occurrence can be used to predict if an adversary will leverage the same tactics (as used in the SolarWinds supply chain attack) in the future. The more likely to occur the more likely to succeed.
What stood out the most when looking at average relative frequency per week is the combination of Suspicious Privileged Access and Suspicious Azure AD Operations at number two and three.
Misuse of privileged access is a key part of lateral movement as it leads to the most valuable capabilities and information. Adversaries use multiple techniques ranging from stolen credentials, protocol abuse, malware, phishing, or merely guessing at simple and default account names and passwords to gain access to privileged accounts.
Even with privileged access management tools are in place these accounts rarely receive direct oversight or control of how they are used. This lack of oversight creates the greatest risk for organizations. If used improperly, privileged accounts can be used to steal data, perform espionage, sabotage, or ransom an organization.
Controlling and mitigating risk
Behaviors like the ones exhibited during the SUNBURST & SolarFlare attack occur regularly across all organizations. Understanding the context of these behaviors is key to understanding their impact and if action needs to be taken. It is critically important to monitor cloud-native and hybrid cloud environments as well as determine how to correlate data and context from both into actionable information for security analysts.
This means understanding how privilege access occurs across local networks, remote workers, private data centers, and cloud instances, in addition to monitoring hosts.
Visibility into privileged access and other attacker behaviors is dependent on the implementation of proper tools that leverage data from across today’s zero trust networks, from the enterprise network to data centers, IoT devices, and cloud environments. Stitching these together eliminates the blind spots and increases the likelihood of detecting post-compromise activities before a catastrophic breach occurs.
Learn more how Vectra can help you if you think you may have been compromised by the SolarWinds breach.